Note
Go to the end to download the full example code
Sparse Grid Interpolation
We will use the Genz benchmark to illustrate how to use a sparse grid as a surrogate for uncertainty quantification and sensitivity analysis
First we must load the benchmark
import numpy as np
from pyapprox.benchmarks import setup_benchmark
from pyapprox import surrogates
from pyapprox.analysis import visualize
from pyapprox import util
import matplotlib.pyplot as plt
benchmark = setup_benchmark('genz', nvars=2, test_name="oscillatory")
np.random.seed(1)

#We can set a maximum number of samples using the options dictionary
options = {"max_nsamples": 100, "verbose": 0}
approx = surrogates.adaptive_approximate(
    benchmark.fun, benchmark.variable, "sparse_grid", options).approx
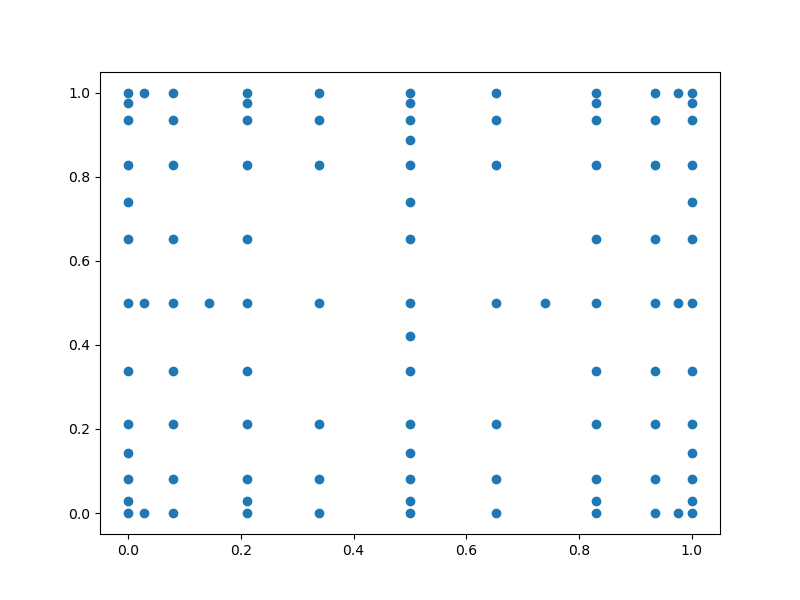
Plot the sparse grid samples with
sparse_grid_samples = approx.get_samples()
util.plot_2d_samples(sparse_grid_samples, marker='o')
plt.show()
We can estimate the error in the surrogate using some validation samples.
validation_samples = benchmark.variable.rvs(100)
validation_values = benchmark.fun(validation_samples)
approx_values = approx(validation_samples)
error = np.linalg.norm(validation_values-approx_values, axis=0)/np.sqrt(
    validation_values.shape[0])
print(f"The RMSE error is {error}")
The RMSE error is [4.6830029e-16]
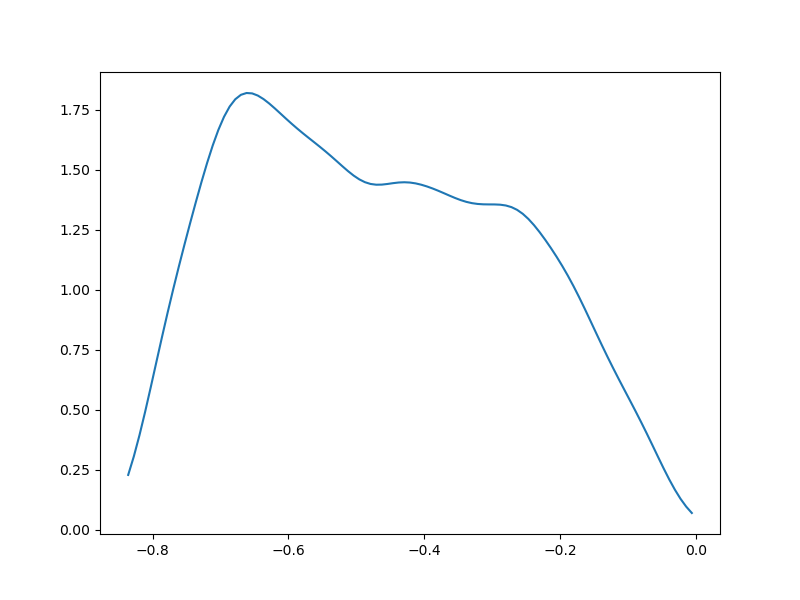
and building a kernel density estimator. Lets first just plot the marginal PDFs of the output
surrogate_samples = benchmark.variable.rvs(10000)
approx_values = approx(surrogate_samples)
visualize.plot_qoi_marginals(approx_values)
plt.show()
Total running time of the script: ( 0 minutes 0.129 seconds)