Power Generation Analysis
Input
At this point you should have already setup the input files and style files as detailed in Prepare Tutorial Files.
To run this demonstration, use the Load GUI Inputs button located at the bottom left of the SEAT GUI, navigate to DEMO/pacwave/all_modules.ini, and click OK to load the inputs. If you need detailed instructions on how to load inputs, please refer to the Save & Load Configuration section in the SEAT QGIS Plugin documention.
Note
Your paths will differ than the ones shown in the example below. If you get an error double check the paths making sure the files exist at the specified location.
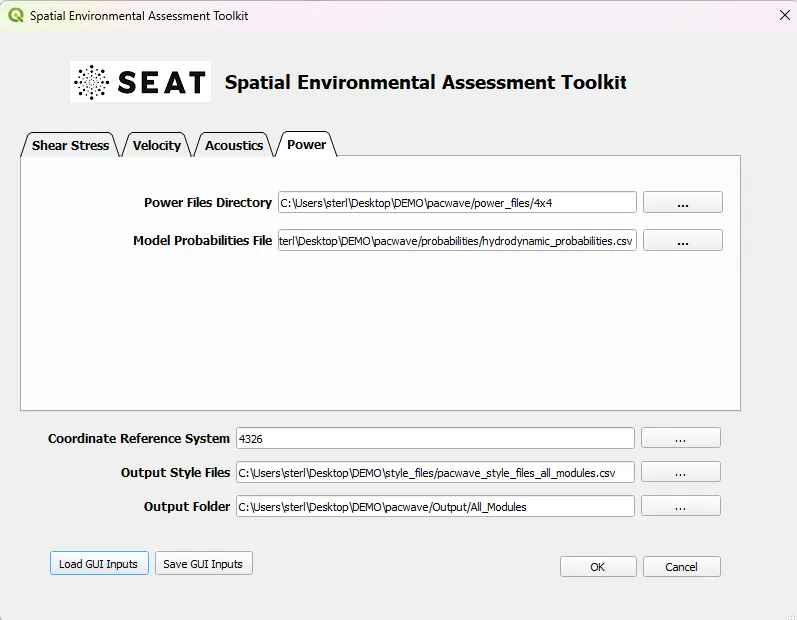
Output
The power generation is saved as individual images and tables in the selected output folder.
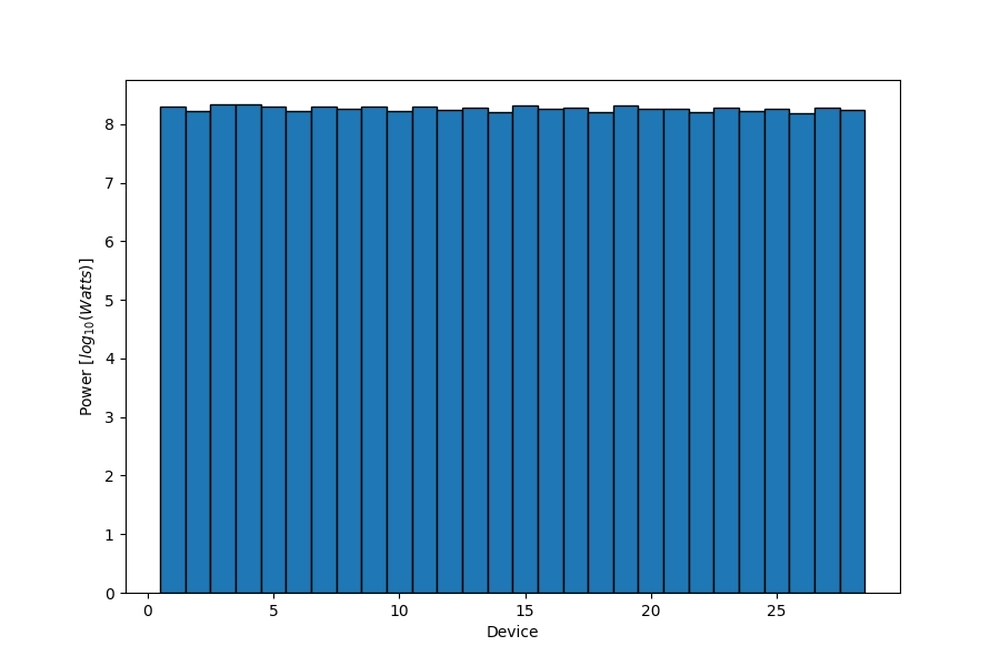
PacWave power generated per device bar plots |
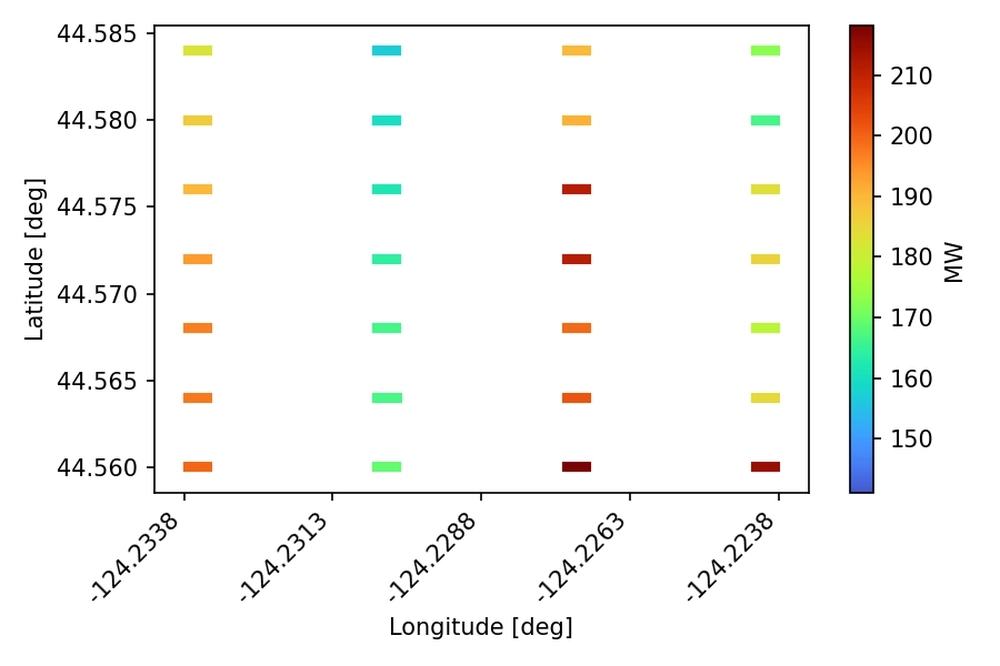
PacWave power generated per device heat map |
PacWave power generated per hydrodynamic scenario
Hs [m] |
Tp [s] |
Dp [deg] |
% of dir bin |
% of yr |
run order |
Exclude |
Power_Run_Name |
Power [W] |
1.76 |
6.6 |
221.8 |
15.41 |
0.39 |
6 |
POWER_ABS_010.OUT |
9526874.11104 |
|
2.67 |
8.62 |
220.8 |
40.68 |
1.029 |
16 |
POWER_ABS_004.OUT |
7461649.7576523 |
|
4.06 |
10.16 |
221.3 |
23.47 |
0.593 |
20 |
POWER_ABS_021.OUT |
55647583.948375 |
|
1.37 |
15.33 |
224.0 |
8.06 |
0.204 |
2 |
POWER_ABS_014.OUT |
7647446.853708 |
|
7.05 |
12.6 |
223.6 |
3.42 |
0.086 |
24 |
x |
POWER_ABS_008.OUT |
1557004.364389 |
2.11 |
11.63 |
223.8 |
8.96 |
0.227 |
11 |
POWER_ABS_001.OUT |
2096482.510244 |
|
4.91 |
13.62 |
251.2 |
11.99 |
1.764 |
23 |
POWER_ABS_019.OUT |
108518849.444376 |
|
1.7 |
7.73 |
244.8 |
15.03 |
2.212 |
5 |
POWER_ABS_017.OUT |
61361227.458748 |
|
2.69 |
9.8 |
247.6 |
26.75 |
3.937 |
17 |
POWER_ABS_018.OUT |
160789701.758536 |
|
1.23 |
14.62 |
248.8 |
18.54 |
2.729 |
1 |
POWER_ABS_023.OUT |
284194057.07551 |
|
2.31 |
17.54 |
249.4 |
3.97 |
0.584 |
14 |
POWER_ABS_006.OUT |
4375975.620376 |
|
2.94 |
11.77 |
250.6 |
23.72 |
3.49 |
18 |
POWER_ABS_016.OUT |
73690186.40957 |
|
4.9 |
14.43 |
275.8 |
8.78 |
4.698 |
22 |
x |
POWER_ABS_020.OUT |
274670833.036 |
1.54 |
8.62 |
278.0 |
20.9 |
11.188 |
4 |
POWER_ABS_011.OUT |
206396778.152828 |
|
3.66 |
12.0 |
277.2 |
20.95 |
11.212 |
19 |
x |
POWER_ABS_022.OUT |
1149464816.402932 |
2.16 |
10.71 |
277.5 |
25.39 |
13.589 |
12 |
POWER_ABS_002.OUT |
138944163.638549 |
|
1.85 |
13.54 |
277.2 |
16.21 |
8.674 |
8 |
POWER_ABS_009.OUT |
234565689.801772 |
|
2.05 |
16.51 |
276.4 |
7.77 |
4.159 |
9 |
x |
POWER_ABS_012.OUT |
76625472.247148 |
1.81 |
9.11 |
298.6 |
28.46 |
8.297 |
7 |
POWER_ABS_015.OUT |
205252148.144181 |
|
2.16 |
13.35 |
295.7 |
10.7 |
3.12 |
13 |
POWER_ABS_003.OUT |
12932737.5357336 |
|
1.49 |
7.12 |
304.6 |
22.86 |
6.664 |
3 |
POWER_ABS_024.OUT |
1933807850.66 |
|
2.66 |
11.02 |
297.2 |
26.48 |
7.72 |
15 |
POWER_ABS_013.OUT |
161208626.795492 |
|
2.08 |
16.53 |
295.6 |
5.28 |
1.54 |
10 |
POWER_ABS_007.OUT |
13757051.63756 |
|
4.65 |
13.23 |
296.2 |
6.22 |
1.813 |
21 |
POWER_ABS_005.OUT |
15581540.517641 |
The specified output folder contains the following files.
 1 Output
 2 └───All_Modules
 3     └───Power Module
 4        BC_probability_wPower.csv
 5        Device Number Location.png
 6        Device_Power.png
 7        Obstacle_Locations.png
 8        Obstacle_Matching.csv
 9        Power_per_device_annual.csv
10        Power_per_device_per_scenario.csv
11        Scaled_Power_Bars_per_run_obstacle.png
12        Scaled_Power_per_device_per_scenario.png
13        Total_Scaled_Power_Bars_per_obstacle.png
14        Total_Scaled_Power_Bars_per_Run.png
15        Total_Scaled_Power_per_Device_.png