SEAT QGIS Plugin
Welcome to the guide on how to navigate and utilize the SEAT’s graphical user interface (GUI). SEAT’s GUI is designed as a QGIS plugin, making your analysis and visualization in QGIS both efficient and user-friendly.
Upon successfully installing the SEAT package in QGIS, you’ll notice a new icon representing SEAT on your plugin toolbar.

To launch the SEAT GUI, simply click on the SEAT icon.
You’ll then be presented with the SEAT GUI. You are presented with Tabbed stressors (and Power) followed by the required common configuration inputs below the tabbed area.
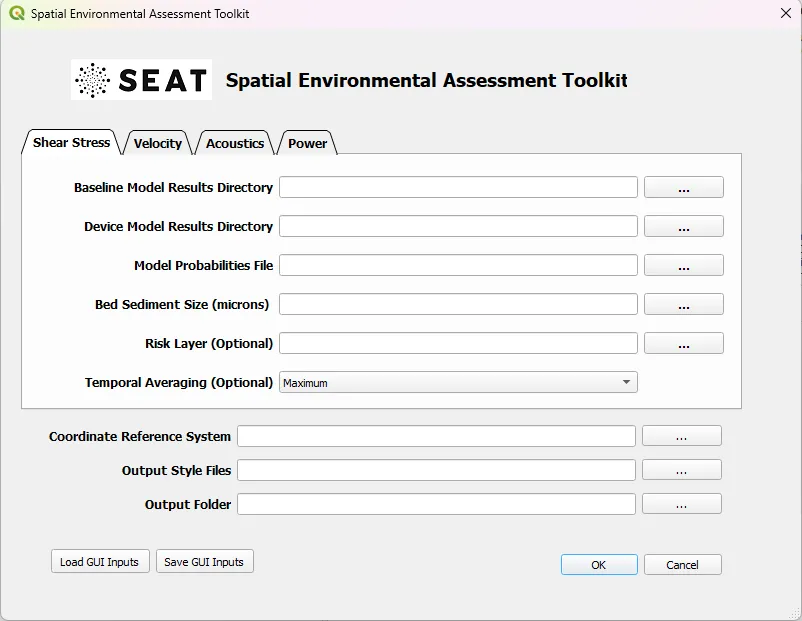
In SEAT, the stressor determines the type of analysis or data to be used. You can select your desired stressor from the from the Tabs. There are three stressor options:
Shear Stress Module: Analyzes the spatial changes in bed mobility.
Velocity Module: Investigates the spatial changes in larval motility.
ParAcousti Module: Examines acoustic propagation and its thresholds.
This documentation is organized into various sections to help you quickly navigate to specific functionalities and settings within the GUI. Below is a brief overview:
Feel free to navigate to the respective sections for detailed information and step-by-step instructions. Or click the next button below to step through the guide in order.