Acoustic Effects
The acoustic effects from the WEC array at PacWave can be evaluated using the Acoustic module in the SEAT GUI. This module reads in individual ParAcousti model .nc files that correspond to wave conditions. At this point you should have already setup the input files and style files as detailed in Prepare Tutorial Files.
Paracousti Pre-Processing
If a specific species is of interest, pre-process the Paracousti output files using the Paracousti Pre-Processing section of the SEAT QGIS plugin. The pre-processing routine applies weighting functions to the acoustic signal, and save out files to a specified directory. For this tutorial the input files are already pre-processed, however, if you’d like to use the pre-processing routine, specify the following directories within the pre_processing script:
paracousti_directory = r"local_path\DEMO_acoustics\pacwave\paracousti_files\\"
save_directory = r"local_path\DEMO_acosutics\pacwave\paracousti_files_with_metrics\\"
Where local_path is the local path to the DEMO files on your machine.
QGIS Dialog
There are two tabs: the Inputs tab and the Species Properties tab.
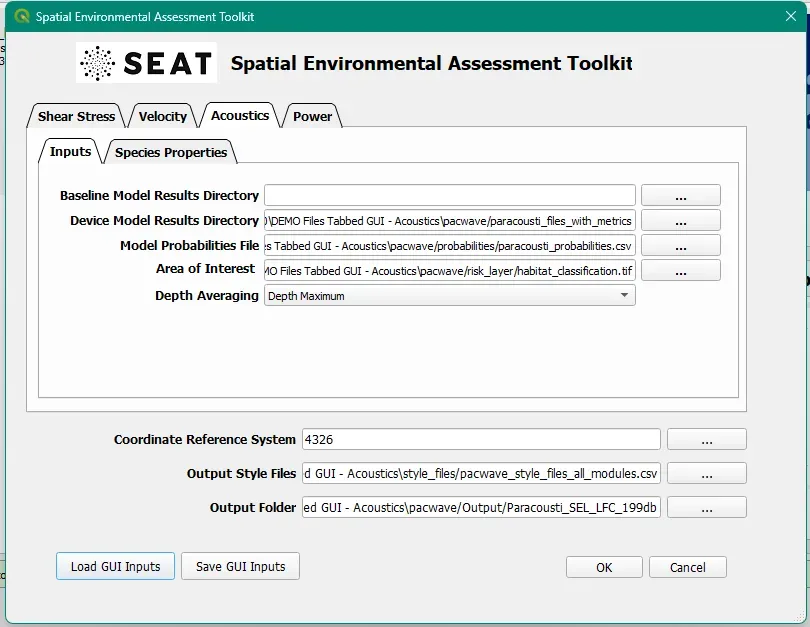
Inputs
The Inputs section of the SEAT QGIS plugin allows users to specify the model results directories and the probabilities file.
To run this demonstration, use the Load GUI Inputs button located at the bottom left of the SEAT GUI, navigate to DEMO_acoustics/pacwave/, and there will be three files available to choose from:
acoustics_module_SEL_199db_threshold.ini: Sound exposure level with a 199db threshold
acoustics_module_SEL_HFC_173db_threshold.ini: Sound exposure level for high frequency ceteceans with a 173db threshold
acoustics_module_SEL_LFC_199db_threshold.ini: Sound exposure level for low frequency ceteceans with a 199db threshold
acoustics_module_SPL_150db_threshold.ini: Sound pressure level with a 150db threshold
acoustics_module_SPL_219dB_threshold.ini: Sound pressure level with a 219db threshold
Click on acoustics_module_SEL_199db_threshold.ini, and click OK to load the inputs. If you need detailed instructions on how to load inputs, please refer to the Save & Load Configuration section in the SEAT QGIS Plugin documention. All fields for both tabs will be filled out with the appropriate information.
Baseline results directory contains the baseline conditions which are the model results without any devices present. If left blank, 0 dB will be assumed.
Device Model Results Directory contains the model results with the devices.
Probabilities File defines the likelihood of each model condition occurring.
Area of Interest File contains spatial classifications used to evaluate the impact of the devices on the environment.
Depth Averaging option allows the user to specify the depth averaging method for the model results.
Note
Your paths will differ from the ones shown in the example below. If you get an error, make sure that the .ini files are pointing to the right path locations.
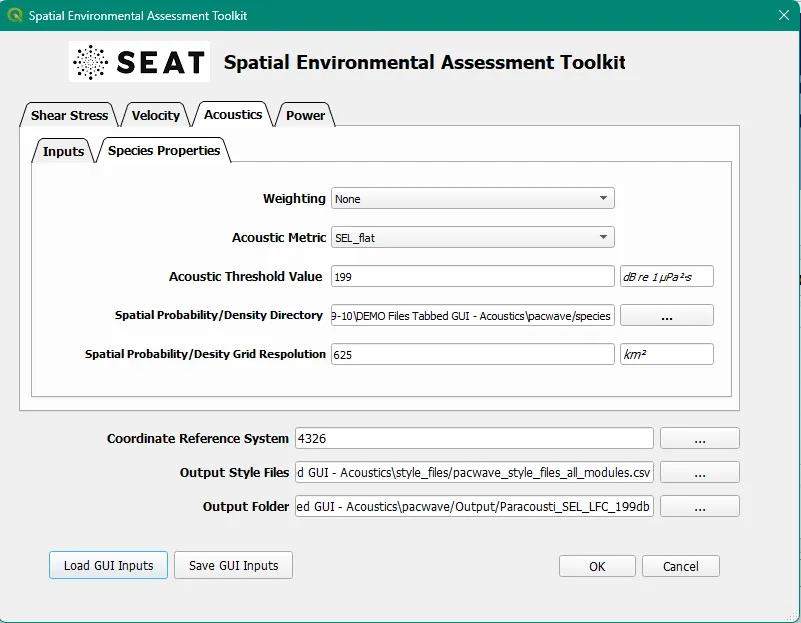
Species Properties
The Species Properties section of the SEAT QGIS plugin allows users to specify the species spatial probability/density directory and the species file averaged area.
Note
The plugin may take several minutes to run depending on the machine.
Output
For a given probability of occurrence of each wave condition, the combined annual acoustic effects is estimated. SEAT generates a similar stressor layer consisting of the difference between the acoustic effects with and without the array. With a provided receptor file which consists of information regarding the species, threshold value, weighting, and variable used, a threshold map is generated as a percentage of time (based on the probability distribution) that a threshold will be exceeded. For demonstration purposes, an artificially low threshold is used to generate the percent exceeded threshold figure below.
Once the plugin has finished running (which might take several minutes), several output files will appear in the navigation pane:
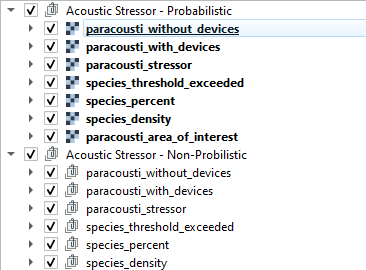
There are two groups of files: Acoustic Stressor - Probabilistic and Acoustic Stressor - Non-Probabilistic.
The Acoustic Stressor - Probabilistic contains the analysis with all the model runs combined via the weights,
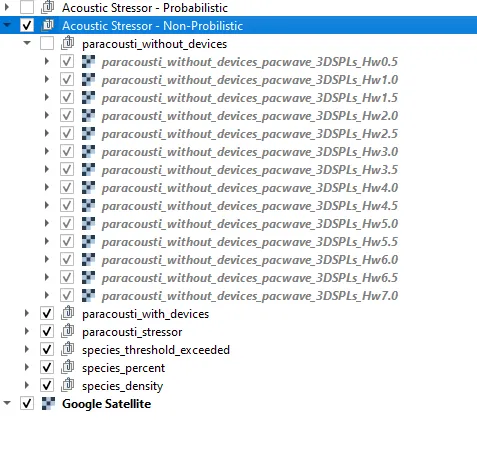
while the Acoustic Stressor - Non-Probabilistic contains the analysis for each weighted model run. The output files are the same with the model run name (e.g., 3DSPLs_Hw7.0) concated onto the filename.
There are four types of output files:
paracousti_without_devices.tif: The probability weighted signal without devices (baseline weighted by the probability that an environmental condition will occur)
paracousti_with_devices.tif: The probability weighted signal with devices
paracousti_stressor.tif : The difference between with devices and baseline models results.
species_threshold_exceeded : the probability that the acoustic signal generated by the device will exceed the species-specific threshold in a given 24 hour period. Takes into account the model weights for different model conditions.
species_percent : for a given location, if the the device exceeds a threshold, the probability the species will be present in a 24-hour period. Uses the species density, the acoustic signal generated by the devices, and the threshold limit.
species_density : for a given location, if the the device exceeds a threshold, the number of individuals present. Uses the species density, the acoustic signal generated by the devices, and the threshold limit.
paracousti_area_of_interest : the Area of Interest input provided, cropped to the location of interest.

paracousti_without_devices:Baseline acoustic signal, here 0 |
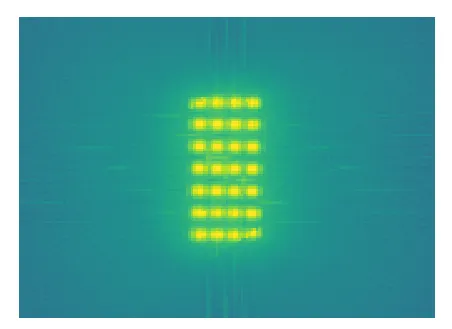
paracousti_with_devices:With Devices acoustic signal |
paracousti_stressor: The difference between the baseline acoustic signal and with devices |
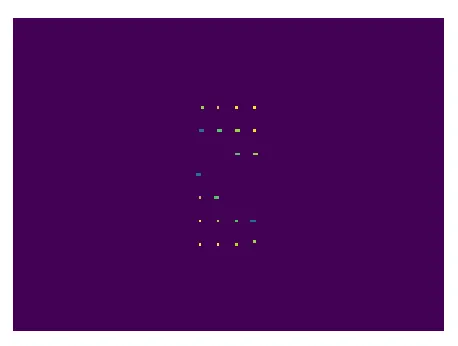
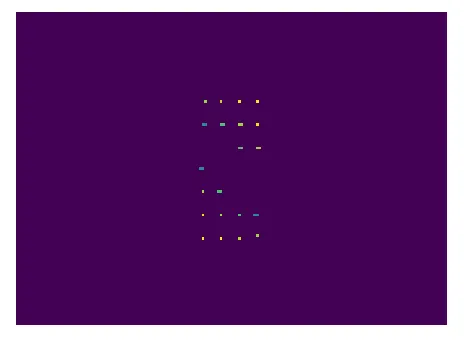
species_threshold_exceeded: the probability the signal will exceed the threshold in a given 24 hour period.
Ranges from 0-100, here is higher at the corners of the array (97%), and lower at the center (around 57%) |
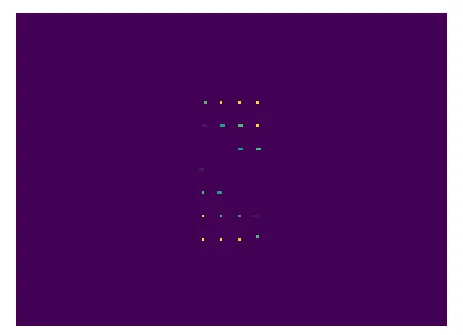
Species Percent: the probability a species will be present when the acosutic signal exceeds a threshold in a 24 hour period. The values are small ~ O(-5), indicating that there is a very low chance that individuals would be present in the area.
|
Species Density: the number of individuals expected to be present when the acoustic signal exceeds a threshold in a 24 hour period. The values are small ~ O(-7), indicating that there would be very few individuals in the area. |
Note that in this example, the baseline is 0, and the threshold is set to 199dB.
Since the baseline is 0, the stressor is equal to the acousti_devices_present.
The number of whales that typically travel through the area is very small, so, as a result, both the species_percent and species density are very small.
Non-Probabilistic Files
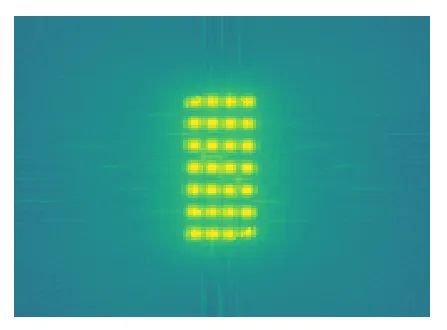
For the non-probabilistic files, there are different paracousti stressors for each model run. The model run with a wave height of 0.5m has a lower paracousti signal than the model run with a wave height of 7.0m.
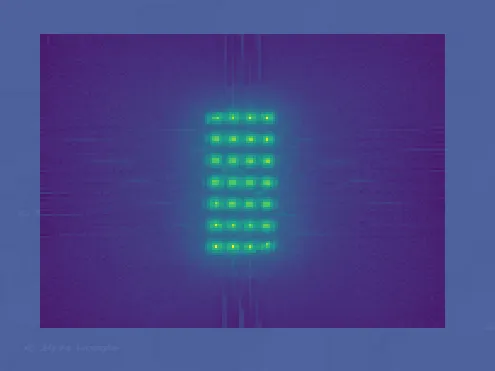
Hw0.5 |
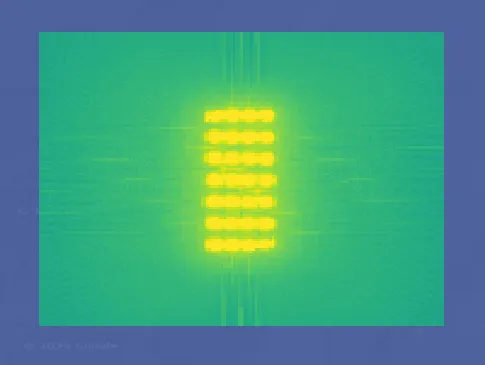
Hw7.0 |
Output CSVs and TIFs
.csv and .tif Output files can be found in the specifed Output folder. Note that the * in the filenames are placeholders for the model run names (for example, 3DSPLs_Hw7.0).
Output
└───paracousti_sel_199db
    └───Acoustics Module
         paracousti_area_of_interest.tif
         paracousti_stressor.csv
         paracousti_stressor_pacwave_*.csv
         paracousti_stressor_pacwave_*.tif
         paracousti_stressor_at_paracousti_area_of_interest.csv
         paracousti_stressor_pacwave_*_*_at_paracousti_area_of_interest.csv
         paracousti_without_devices.csv
         paracousti_without_devices_pacwave_*.tif
         paracousti_with_devices.csv
         paracousti_with_devices.tif
         paracousti_with_devices_pacwave_*.csv
         paracousti_with_devices_pacwave_*.tif
         species_density.csv
         species_density.tif
         species_density_at_paracousti_area_of_interest.csv
         species_density_pacwave_*.csv
         species_density_pacwave_*.tif
         species_density_at_pacwave_*_paracousti_area_of_interest.csv
         species_percent_pacwave_*.csv
         species_percent_pacwave_*.tif
         species_percent_pacwave_*_at_paracousti_area_of_interest.csv
         species_percent.csv
         species_percent.tif
         species_percent_at_paracousti_area_of_interest.csv
         species_percent_pacwave_*.csv
         species_percent_pacwave_*.tif
         species_percent_pacwave_*_at_paracousti_area_of_interest.csv
         species_threshold_exceeded.csv
         species_threshold_exceeded.tif
         species_threshold_exceeded_at_paracousti_area_of_interest.csv
         species_threshold_exceeded_pacwave_*.csv
         species_threshold_exceeded_pacwave_*.tif
         species_threshold_exceeded_pacwave_*_at_paracousti_area_of_interest.csv