This document is autogenerated from generate_ui_documentation.py. Do not edit this document directly.
Samples per Frame Samples per measurement frame used in the system identification. Some environments force system identification to use the same frame size as the signal processing performed in the environment. If this field cannot be edited here, then check the Environment Definition tab for a similar property.
Averaging Type Type of averaging used in the system identification. Linear averaging weights each measurement frame equally. Exponential averaging treats more recent averages with a higher weight.
Noise Averages Number of measurement frames to acquire to analyze the noise level of the test.
System ID Averages Number of measurement frames to acquire to identify the system and compute transfer functions.
Averaging Coefficient Averaging coefficient used to weight the most recent measurement frame if exponential averaging is used.
Estimator The estimator to use to compute transfer functions when performing system identification.
Level Root-mean-square voltage level to play to the shakers when computing system identification
Ramp Time Time to ramp the system identification voltage to the test level.
On Fraction Fraction of the measurement frame that the burst random excitation is active for.
Pretrigger Percentage of the measurement frame that is before the burst random excitation.
Ramp Fraction Percentage of the burst that is used to ramp from zero to the test level.
Signal Type Excitation used for system identification. Random and Burst random excitation are suitable for MIMO control problems. Chirp and Pseudorandom should only be used for single-shaker excitation.
Window Window function to apply to the data when computing transfer functions during system identification.
Overlap Overlap to use between measurement frames when computing transfer functions.
Bandwidth Minimum Frequency The lowest frequency content in the excitation signal used in system identification.
Bandwidth Maximum Frequency The highest frequency content in the excitation signal used in system identification.
Select File... Opens a file dialog to select the file to which the system identification data will be streamed.
Stream Time Data If checked, time data from system identification will be streamed to disk.
Streaming File: File to which system identification data will be streamed.
Save System Identification Data Save system identification spectral data to a file on the disk.
Load System Identification Data Loads system identification data from a file on the disk. System identification being loaded must contain the same control and excitation degrees of freedom in the same order as the current environment.
Preview Noise Starts the noise identification of the system identification process in preview mode. No excitation will be applied to the shakers. The preview will continue until stopped manually.
Preview System Identification Starts the system identification process in preview mode with excitation applied to the shakers. The preview will continue until stopped manually.
Start Starts the full system identification process, including noise characterization and transfer function computation. Each step will stop automatically when the requested number of averages has been acquired.
Stop Manually stops the system identification process.
Current Averages Current number of system identification averages that have been acquired.
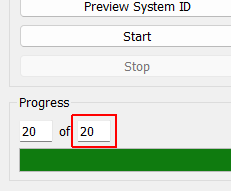
Total Averages Total number of system identification averages that will be acquired.
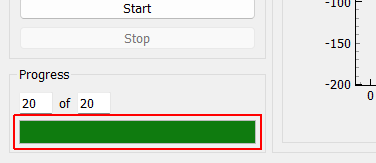
System Identification Progress Bar Graphically displays the system identification’s progress for the current noise or system identification step.
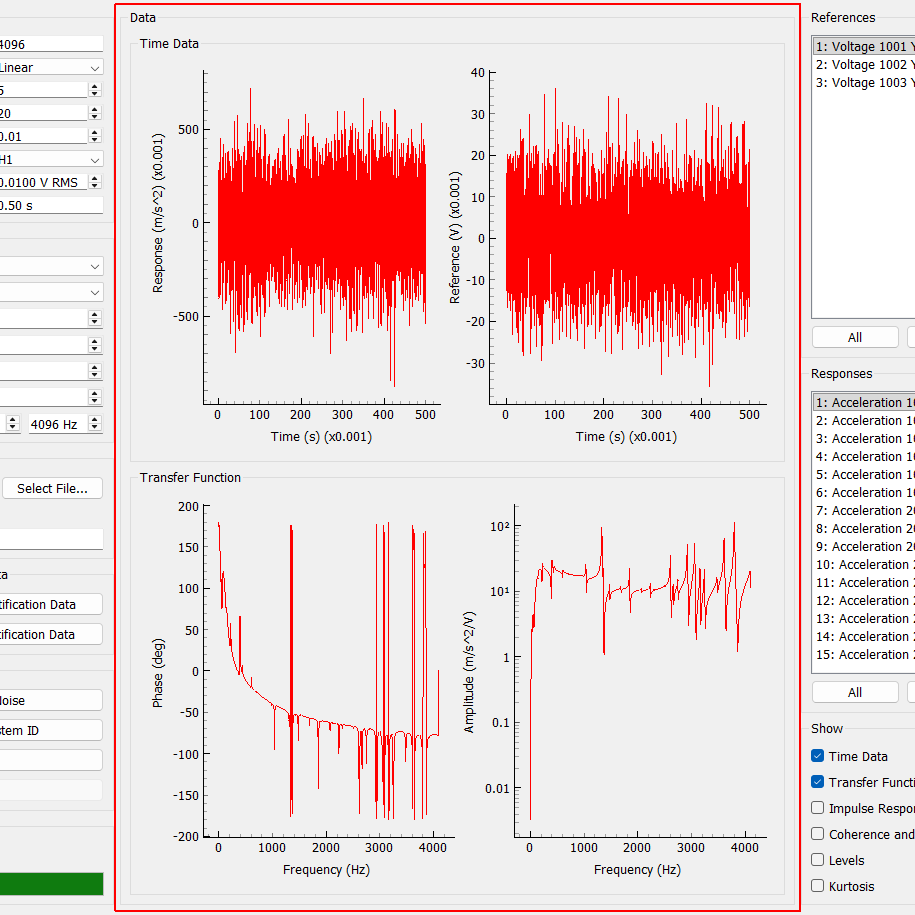
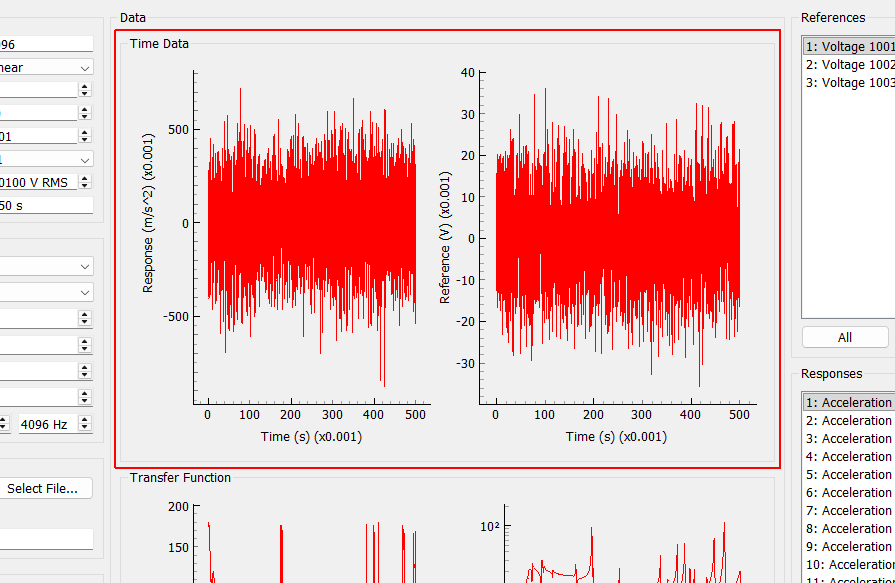
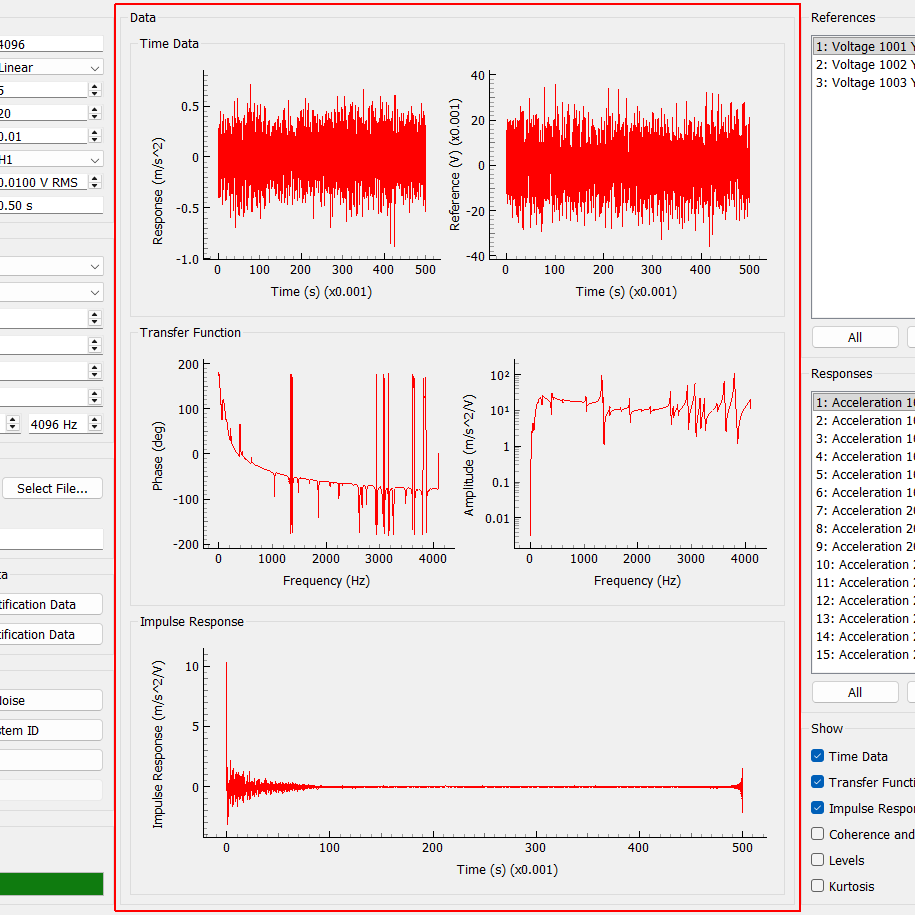
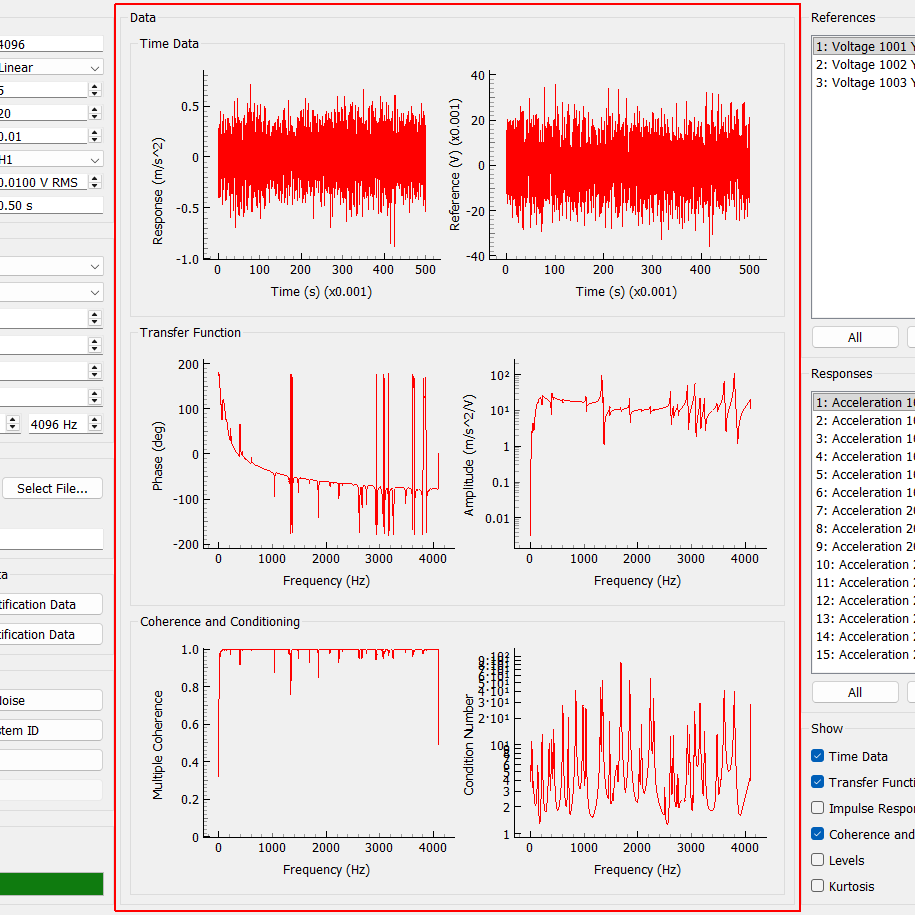
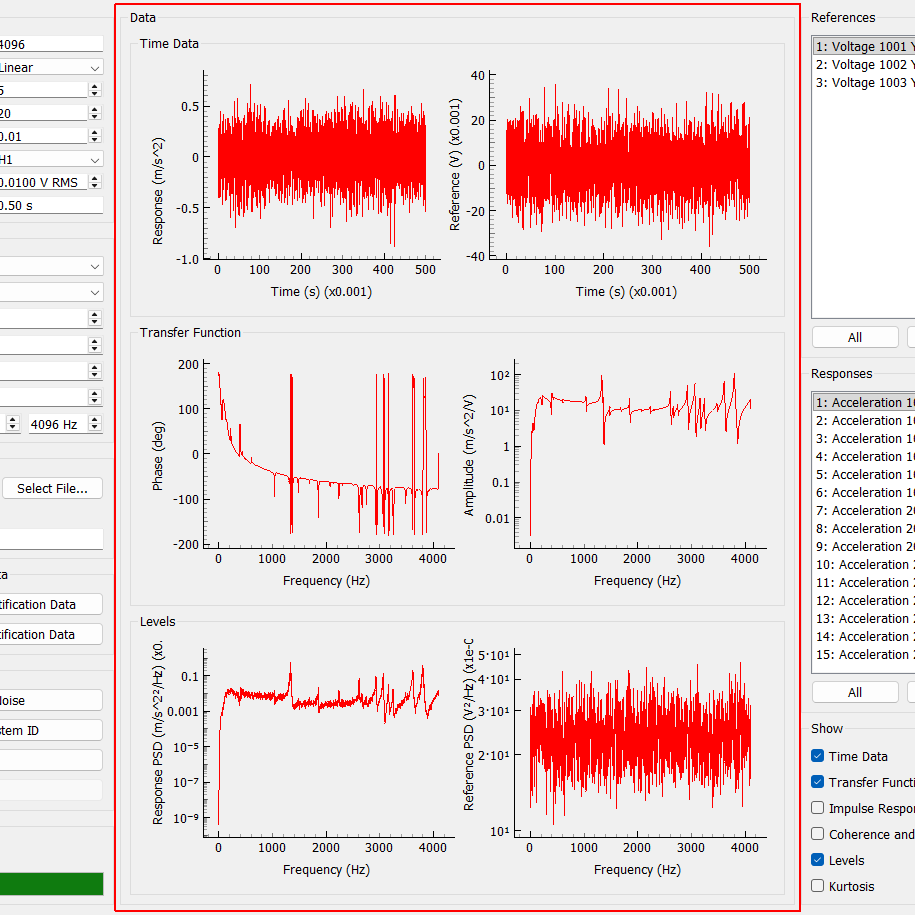
Time Data Plot Displays the most recently acquired measurement frames for the selected reference and response channels.
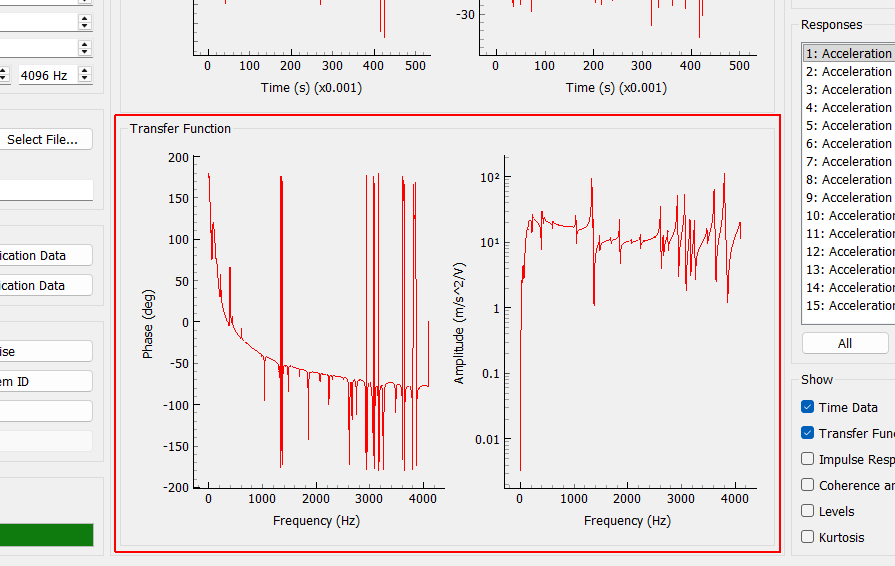
Transfer Function Plot Displays the current estimation of the system transfer functions for the currently selected reference and response channels.
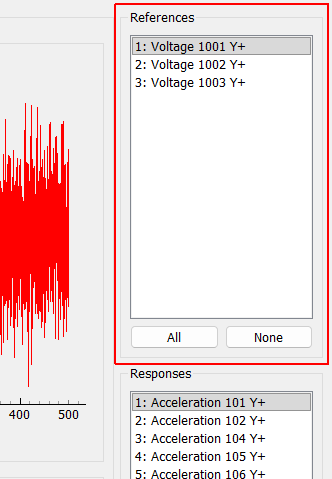
References Select the reference channels to visualize on the plots on the System Identification tab.
All Visualize all references.
None Visualize no references.
Responses Select the response channels to visualize on the plots on the System Identification tab.
All Visualize all responses.
None Visualize no responses.
Time Data Check to show time data during the system identification.
Transfer Function Check to show transfer functions in the system identification.
Impulse Response Check to show the impulse response function, which is the IFFT of the transfer function.
Coherence and Conditioning Check to show multiple coherence and condition number of the transfer function matrix.
Levels Check to show levels for system identification and noise characterization
Kurtosis Check to show kurtosis of response and reference channels.
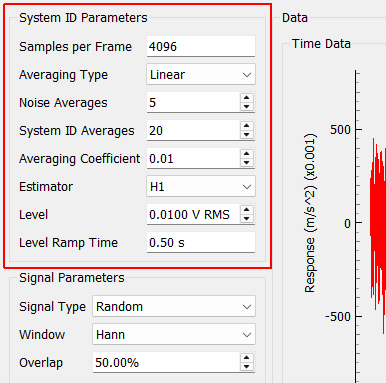
System ID Parameters
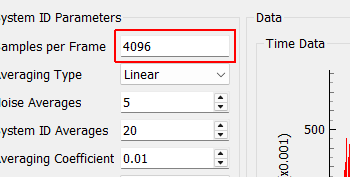
Samples per Frame Samples per measurement frame used in the system identification. Some environments force system identification to use the same frame size as the signal processing performed in the environment. If this field cannot be edited here, then check the Environment Definition tab for a similar property.
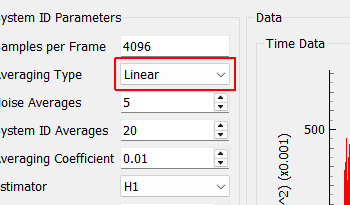
Averaging Type Type of averaging used in the system identification. Linear averaging weights each measurement frame equally. Exponential averaging treats more recent averages with a higher weight.
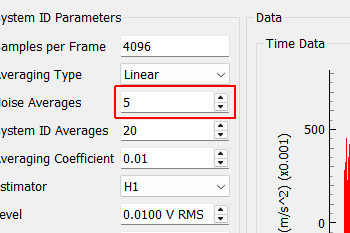
Noise Averages Number of measurement frames to acquire to analyze the noise level of the test.
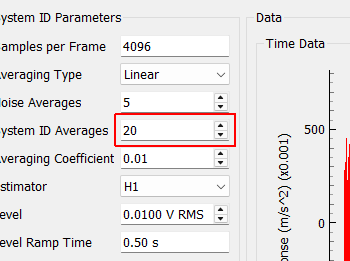
System ID Averages Number of measurement frames to acquire to identify the system and compute transfer functions.
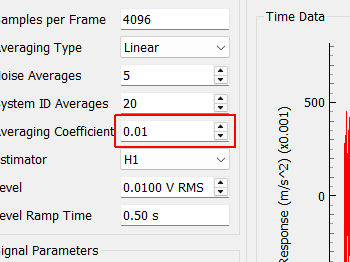
Averaging Coefficient Averaging coefficient used to weight the most recent measurement frame if exponential averaging is used.
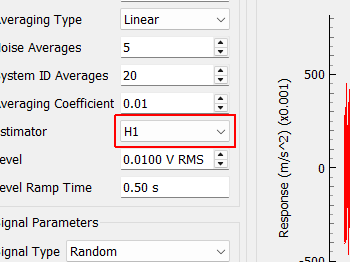
Estimator The estimator to use to compute transfer functions when performing system identification.
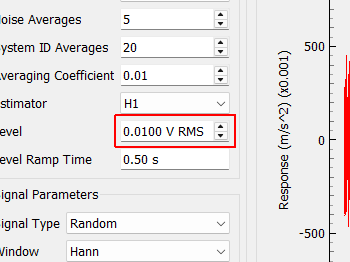
Level Root-mean-square voltage level to play to the shakers when computing system identification
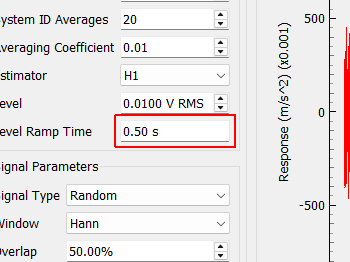
Ramp Time Time to ramp the system identification voltage to the test level.
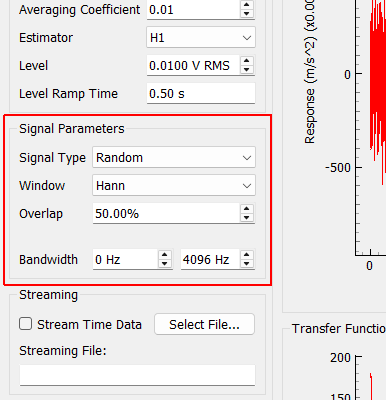
Signal Parameters
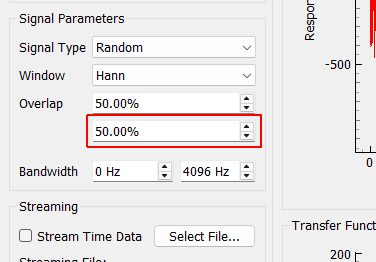
On Fraction Fraction of the measurement frame that the burst random excitation is active for.
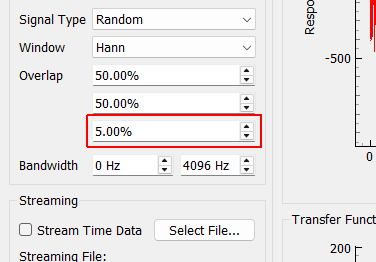
Pretrigger Percentage of the measurement frame that is before the burst random excitation.
Ramp Fraction Percentage of the burst that is used to ramp from zero to the test level.
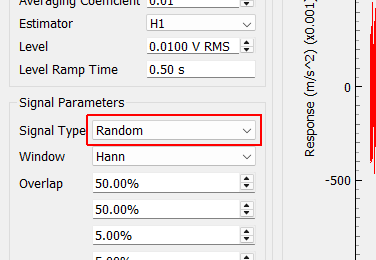
Signal Type Excitation used for system identification. Random and Burst random excitation are suitable for MIMO control problems. Chirp and Pseudorandom should only be used for single-shaker excitation.
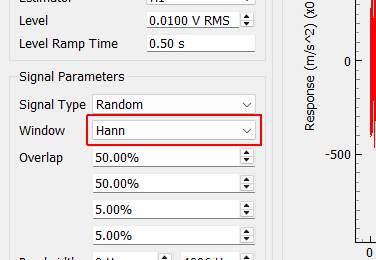
Window Window function to apply to the data when computing transfer functions during system identification.
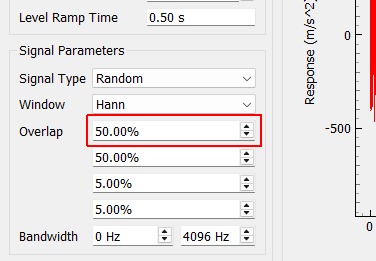
Overlap Overlap to use between measurement frames when computing transfer functions.
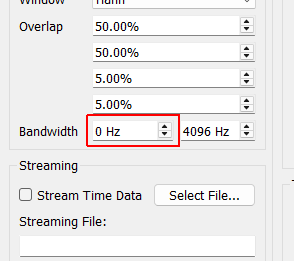
Bandwidth Minimum Frequency The lowest frequency content in the excitation signal used in system identification.
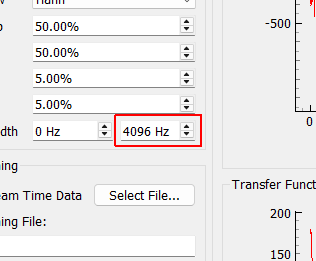
Bandwidth Maximum Frequency The highest frequency content in the excitation signal used in system identification.
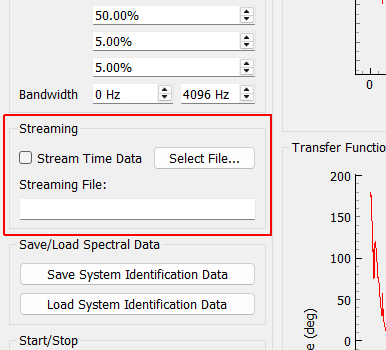
Streaming
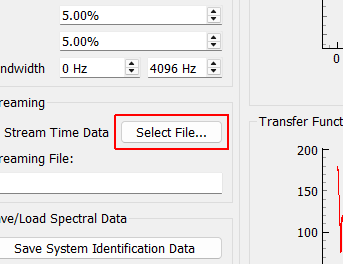
Select File... Opens a file dialog to select the file to which the system identification data will be streamed.
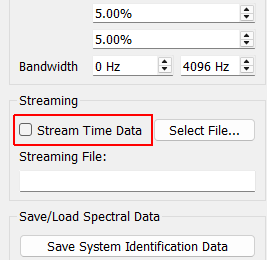
Stream Time Data If checked, time data from system identification will be streamed to disk.
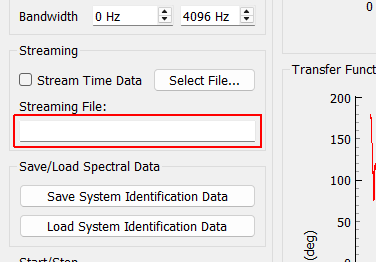
Streaming File: File to which system identification data will be streamed.
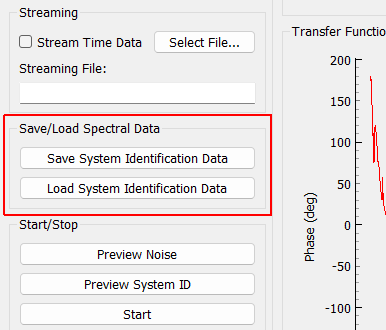
Save/Load Spectral Data
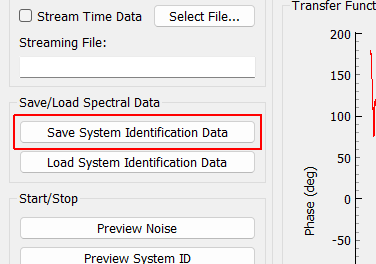
Save System Identification Data Save system identification spectral data to a file on the disk.
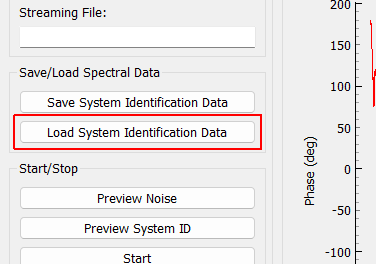
Load System Identification Data Loads system identification data from a file on the disk. System identification being loaded must contain the same control and excitation degrees of freedom in the same order as the current environment.
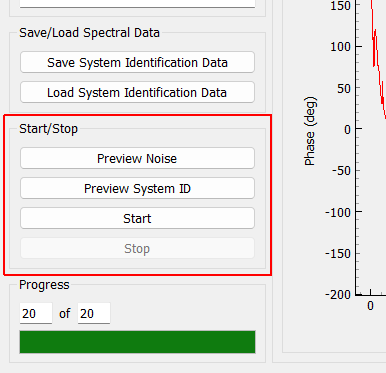
Start/Stop
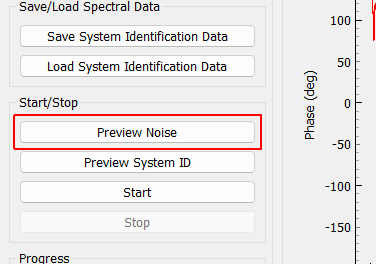
Preview Noise Starts the noise identification of the system identification process in preview mode. No excitation will be applied to the shakers. The preview will continue until stopped manually.
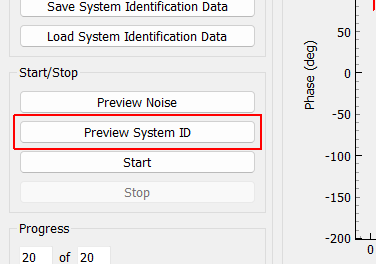
Preview System Identification Starts the system identification process in preview mode with excitation applied to the shakers. The preview will continue until stopped manually.
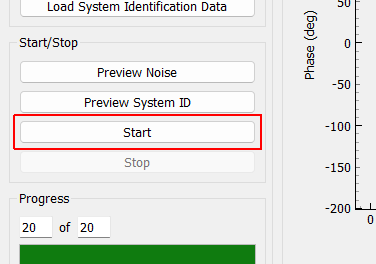
Start Starts the full system identification process, including noise characterization and transfer function computation. Each step will stop automatically when the requested number of averages has been acquired.
Stop Manually stops the system identification process.
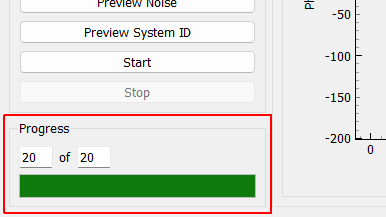
Progress
Current Averages Current number of system identification averages that have been acquired.
Total Averages Total number of system identification averages that will be acquired.
System Identification Progress Bar Graphically displays the system identification’s progress for the current noise or system identification step.
Data
Time Data
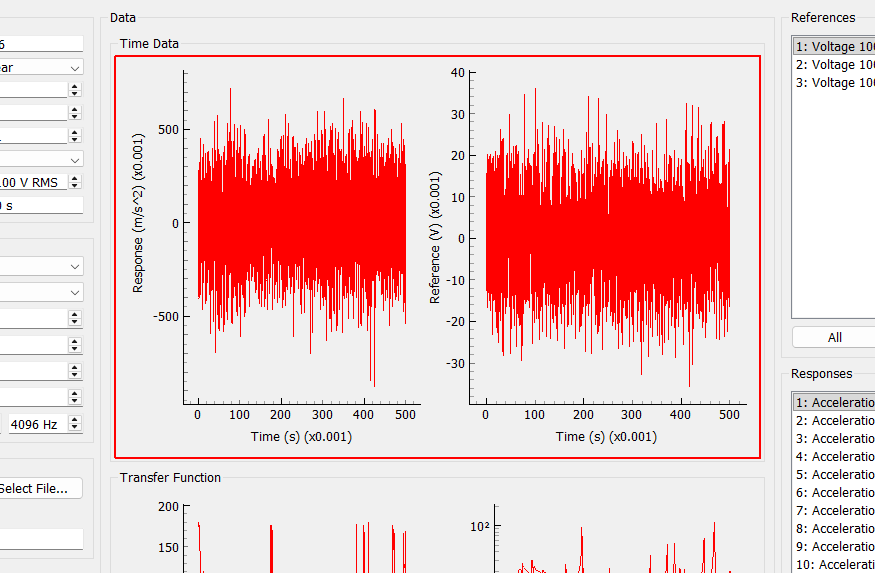
Time Data Plot Displays the most recently acquired measurement frames for the selected reference and response channels.
Transfer Function
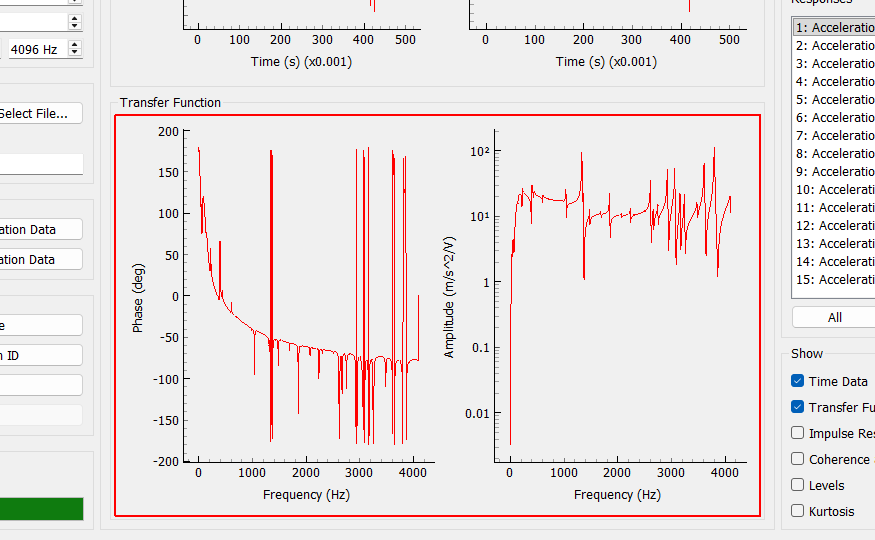
Transfer Function Plot Displays the current estimation of the system transfer functions for the currently selected reference and response channels.
References
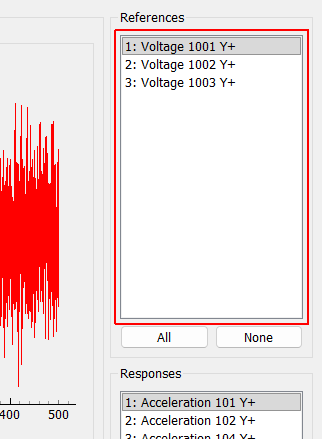
References Select the reference channels to visualize on the plots on the System Identification tab.
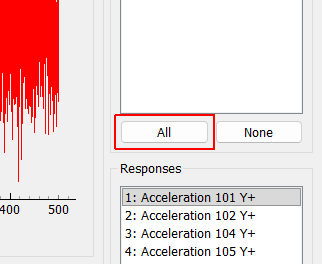
All Visualize all references.
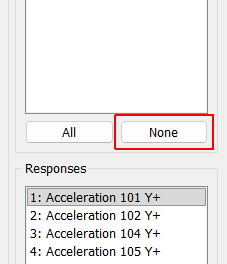
None Visualize no references.
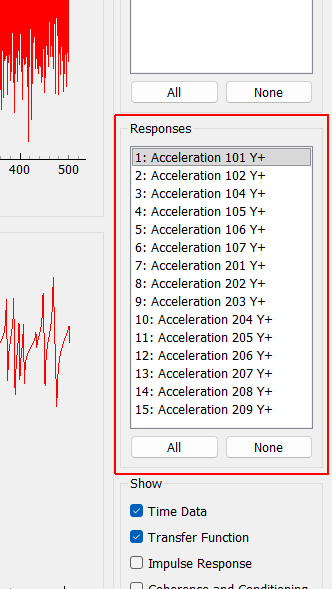
Responses
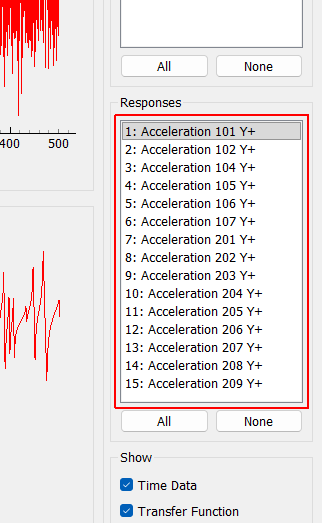
Responses Select the response channels to visualize on the plots on the System Identification tab.
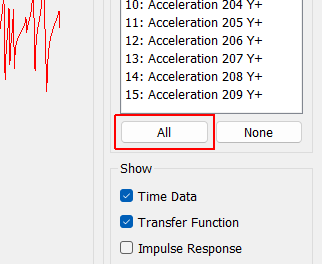
All Visualize all responses.
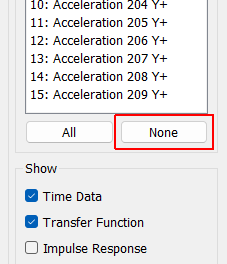
None Visualize no responses.
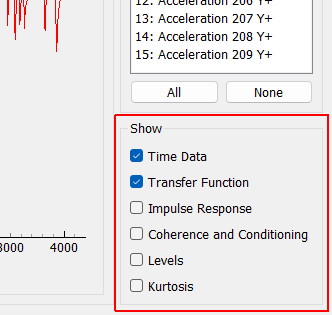
Show
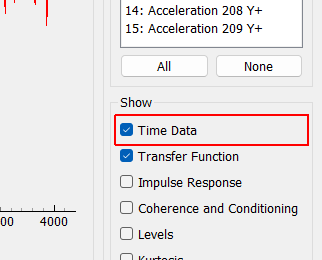
Time Data Check to show time data during the system identification.
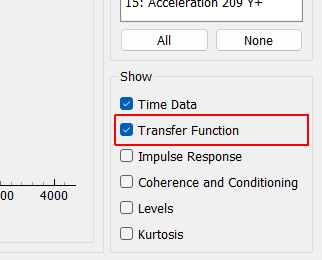
Transfer Function Check to show transfer functions in the system identification.
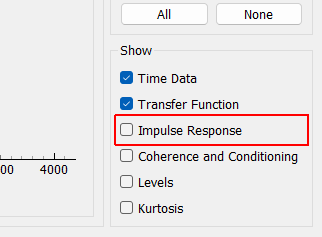
Impulse Response Check to show the impulse response function, which is the IFFT of the transfer function.
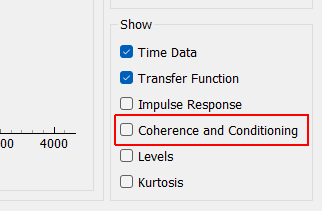
Coherence and Conditioning Check to show multiple coherence and condition number of the transfer function matrix.
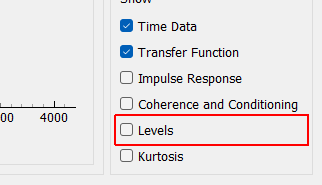
Levels Check to show levels for system identification and noise characterization
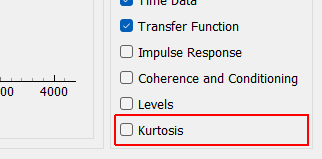
Kurtosis Check to show kurtosis of response and reference channels.
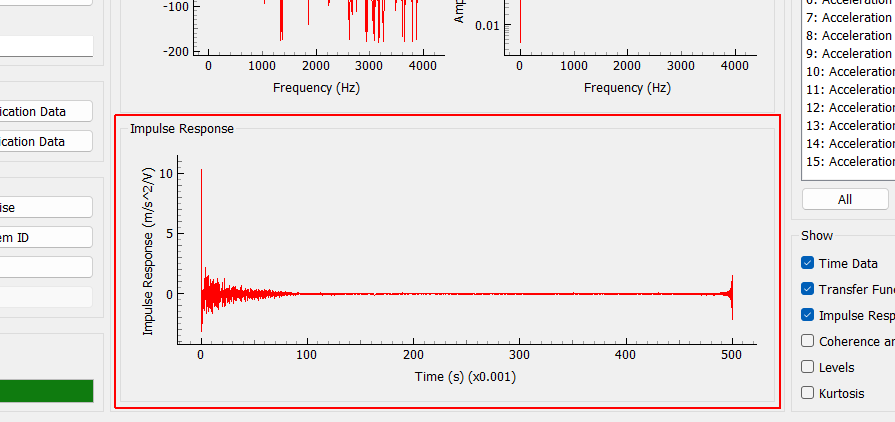
Impulse Response Plot Displays the current estimation of the impulse response function for the currently selected reference and response channels.
Data
Impulse Response
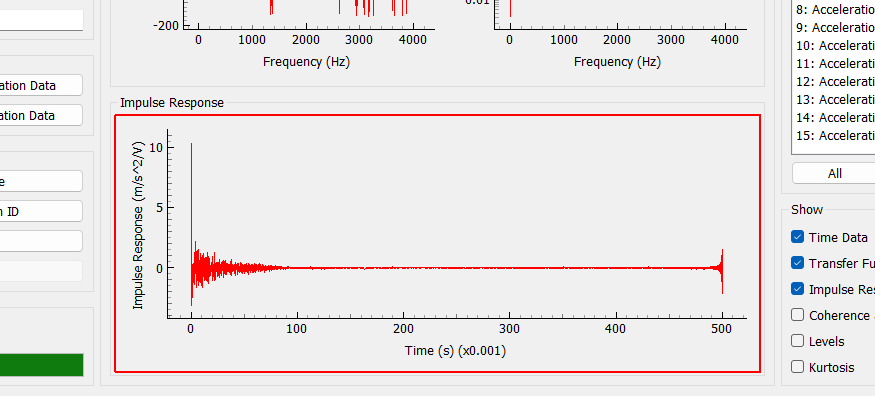
Impulse Response Plot Displays the current estimation of the impulse response function for the currently selected reference and response channels.
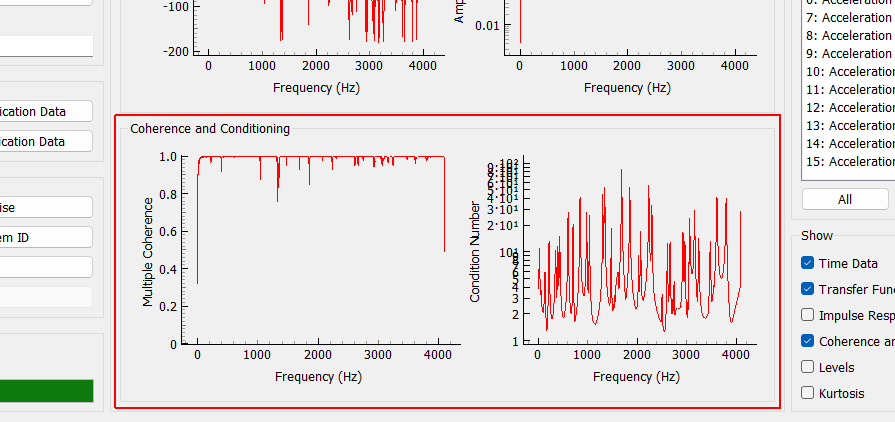
Coherence and Condition Number Plots Displays the multiple coherence for the currently selected response channel, and the condition number for each frequency line in the transfer function matrix.
Data
Coherence and Conditioning
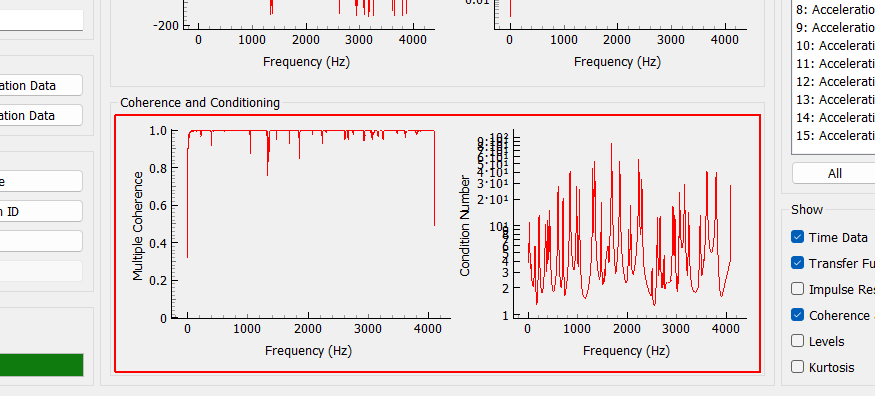
Coherence and Condition Number Plots Displays the multiple coherence for the currently selected response channel, and the condition number for each frequency line in the transfer function matrix.
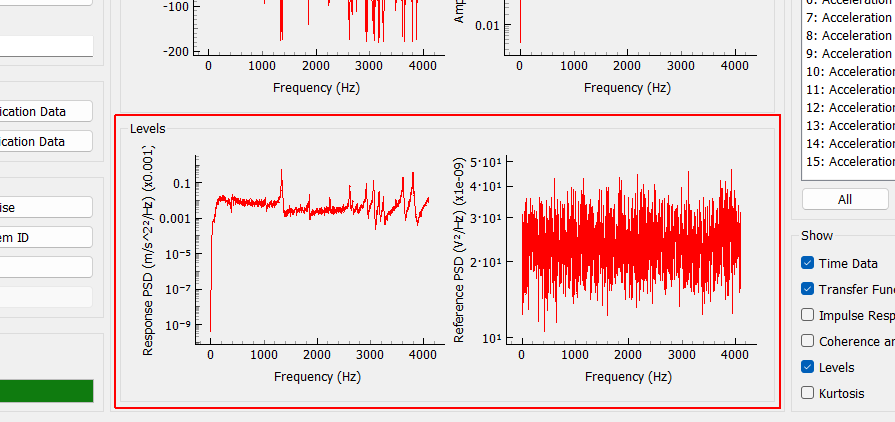
Levels Plots Displays the levels of the selected response and reference channels compared to the noise level on that measurement.
Data
Levels
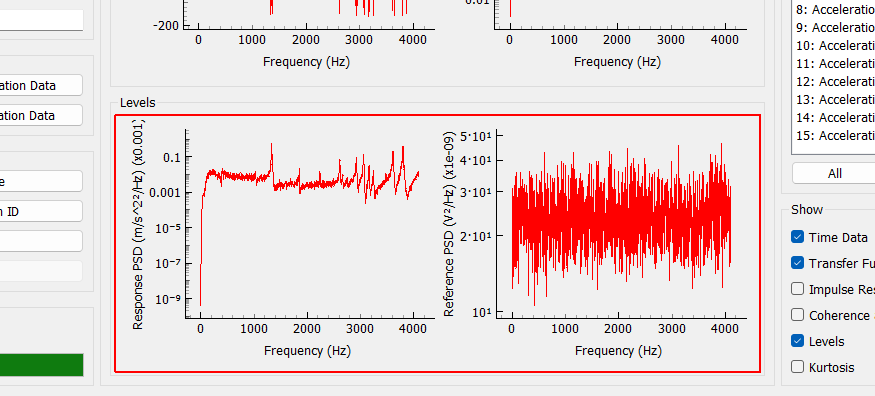
Levels Plots Displays the levels of the selected response and reference channels compared to the noise level on that measurement.
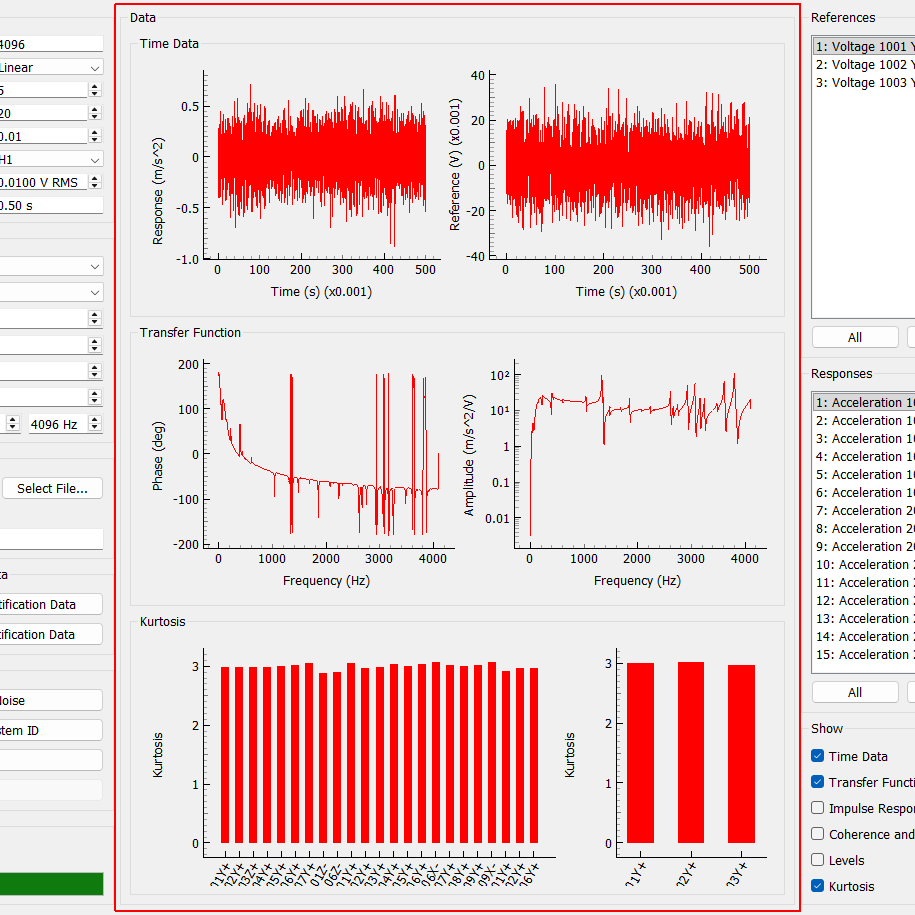
Kurtosis Plot Displays the kurtosis of all channels in the system identification. A kurtosis of 3 suggests gaussian measurements. A value far from 3 suggests some nonlinear effect is distorting the gaussian excitation signals.
Data
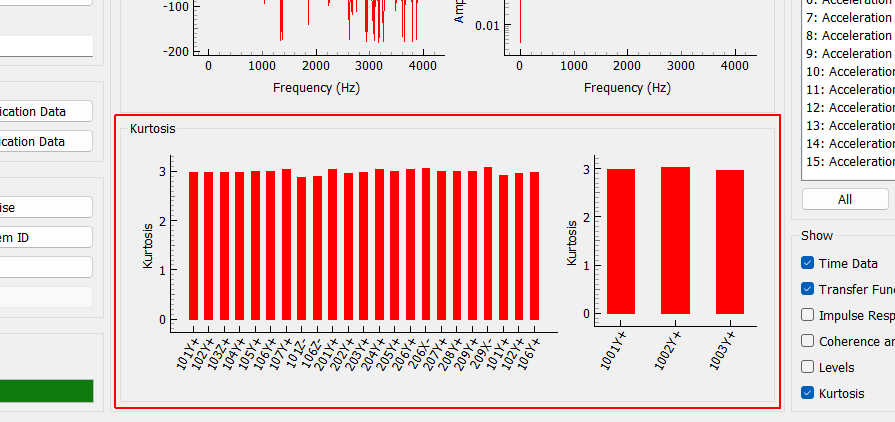
Kurtosis
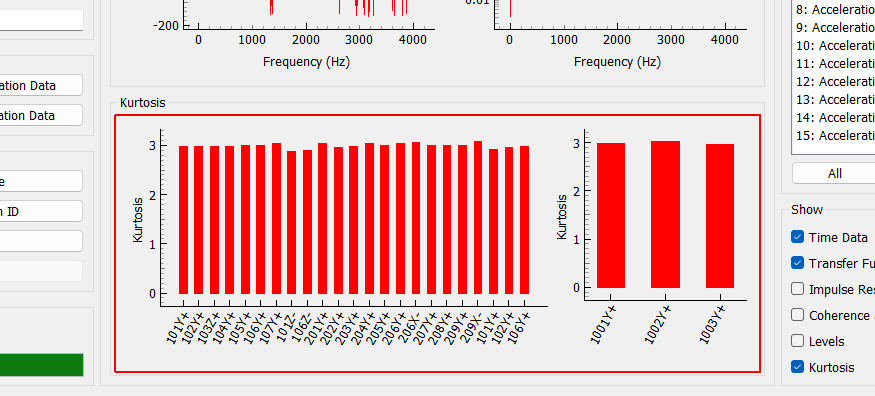
Kurtosis Plot Displays the kurtosis of all channels in the system identification. A kurtosis of 3 suggests gaussian measurements. A value far from 3 suggests some nonlinear effect is distorting the gaussian excitation signals.