This document is autogenerated from generate_ui_documentation.py. Do not edit this document directly.
Peak Response Error (dB) Displays the maximum error between the specified SRS and the predicted or measured SRS in decibels.
Go to Maximum Error Changes the response plots to show the control signal that has the largest maximum error.
Go to Minimum Error Changes the response plots to show the control signal that has the smallest maximum error.
Control SRS Plot Displays the SRS for the specification as well as the predicted and measured signals.
Control Time History Plot Displays the time for the predicted and measured response signals.
Response Selector Selects the control channel that will be displayed on the response plots.
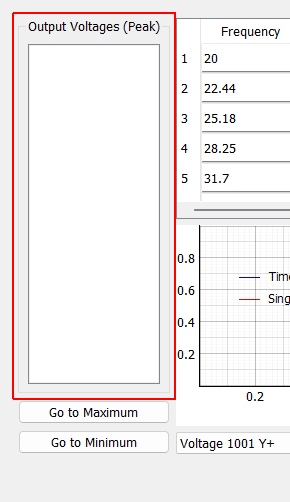
Output Voltages (Peak) Maximum output voltage that will be sent to the shaker to generate the sum-of-decayed-sines signals.
Go to Maximum Voltage Changes the voltage plot to show the excitation signal that reaches the largest maximum value.
Go to Minimum Voltage Changes the voltage plot to show the excitation signal that reaches the smallest maximum value.
Sum of Decayed Sines Table Table showing sum-of-decayed-sines parameters used to generate the output voltage signals.
Excitation Display Displays the time history of the selected voltage signal generated from the sum-of-decayed-sines parameters.
Excitation Selector Specifies the excitation voltage channel to display in the plot.
Recompute Prediction Recomputes the predictions from specified parameters and system identification data.
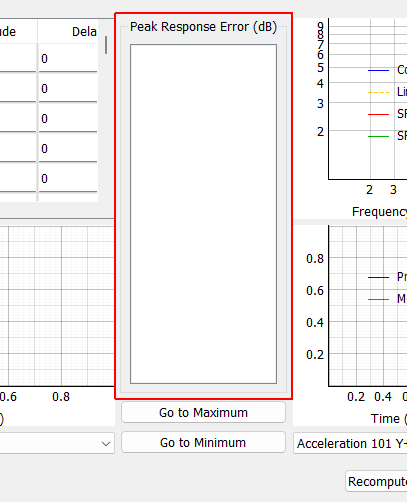
Peak Response Error (dB)
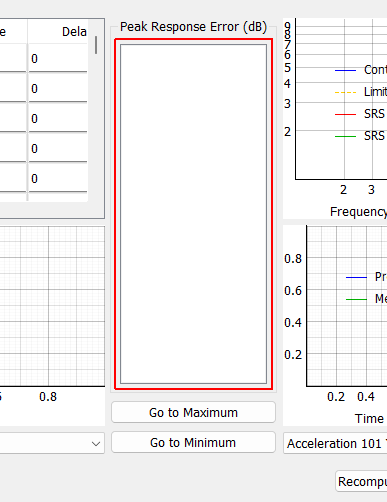
Peak Response Error (dB) Displays the maximum error between the specified SRS and the predicted or measured SRS in decibels.
Go to Maximum Error Changes the response plots to show the control signal that has the largest maximum error.
Go to Minimum Error Changes the response plots to show the control signal that has the smallest maximum error.
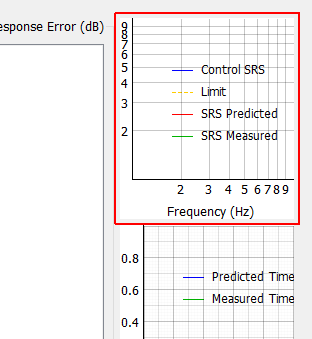
Control SRS Plot Displays the SRS for the specification as well as the predicted and measured signals.
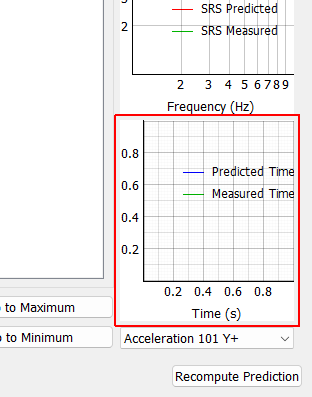
Control Time History Plot Displays the time for the predicted and measured response signals.
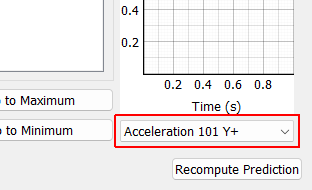
Response Selector Selects the control channel that will be displayed on the response plots.
Output Voltages (Peak)
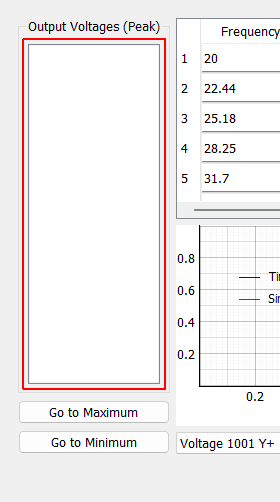
Output Voltages (Peak) Maximum output voltage that will be sent to the shaker to generate the sum-of-decayed-sines signals.
Go to Maximum Voltage Changes the voltage plot to show the excitation signal that reaches the largest maximum value.
Go to Minimum Voltage Changes the voltage plot to show the excitation signal that reaches the smallest maximum value.
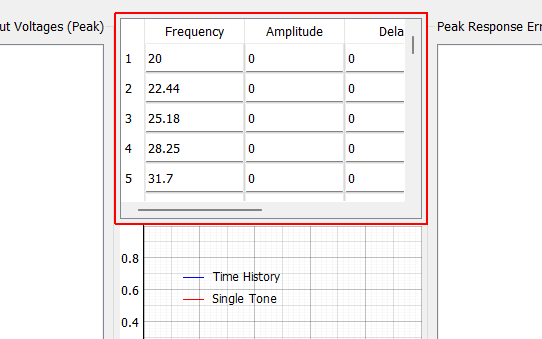
Sum of Decayed Sines Table Table showing sum-of-decayed-sines parameters used to generate the output voltage signals.
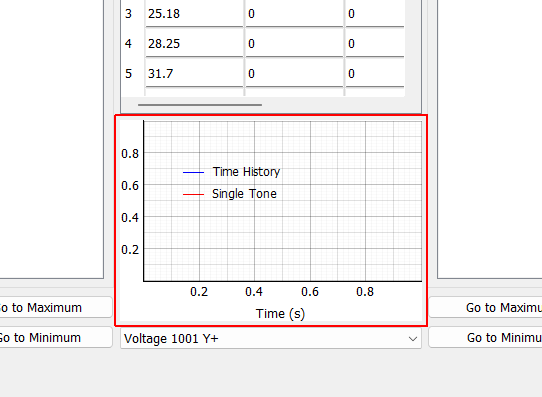
Excitation Display Displays the time history of the selected voltage signal generated from the sum-of-decayed-sines parameters.
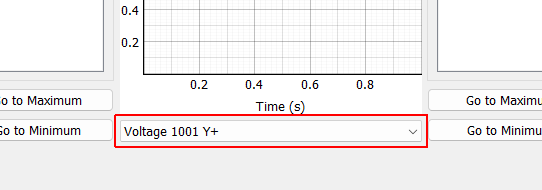
Excitation Selector Specifies the excitation voltage channel to display in the plot.
Recompute Prediction Recomputes the predictions from specified parameters and system identification data.