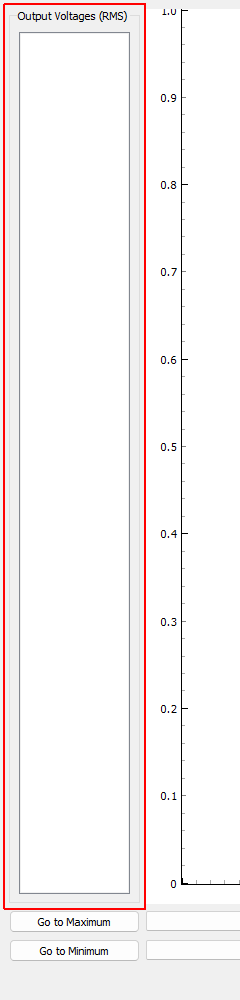
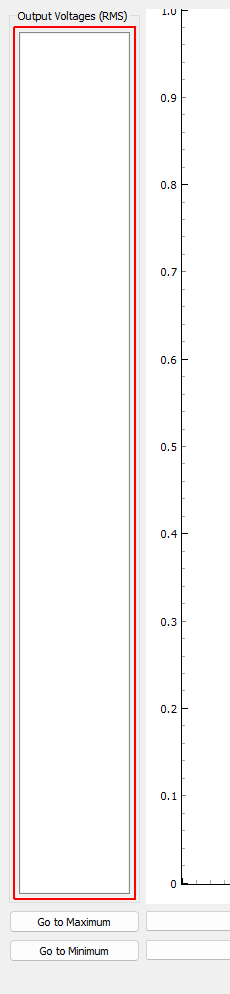
Output Voltage (RMS) RMS Voltage predicted for each excitation channel
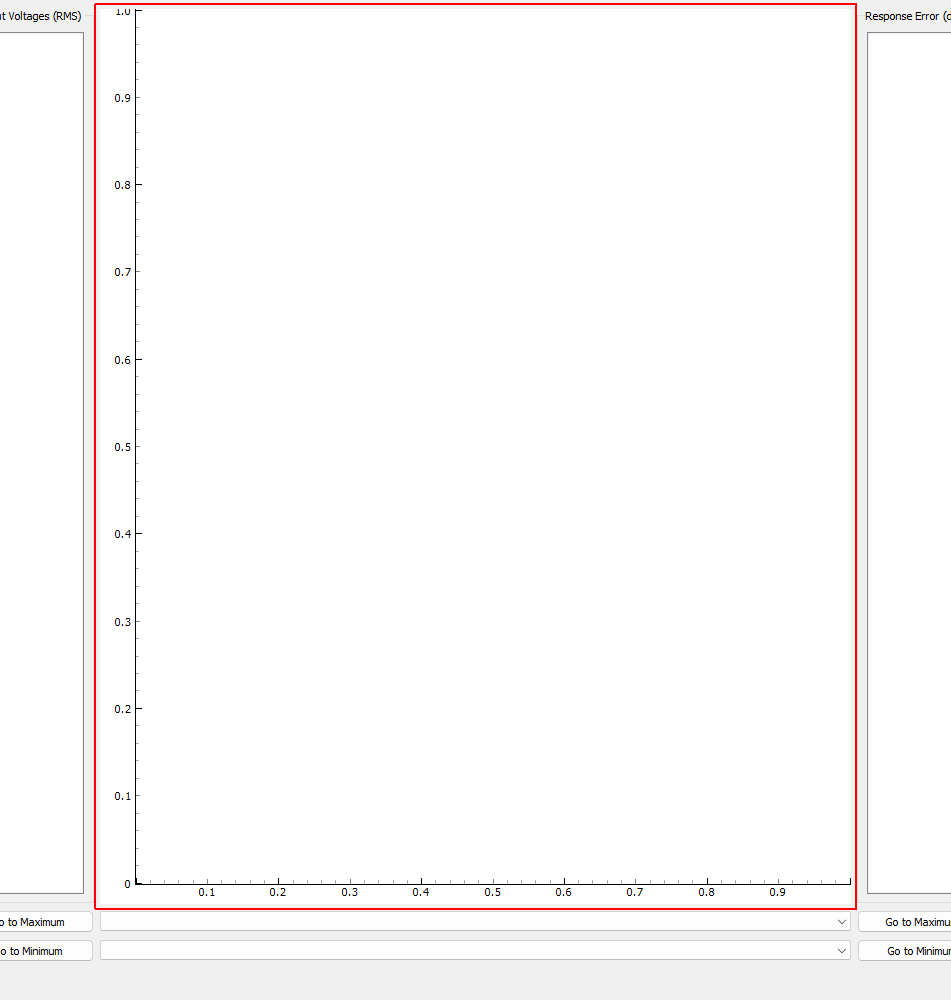
Excitation Display Plot Shows the specified portion of the CPSD matrix. If an off-diagonal term is selected, both real and imaginary parts will be plotted.
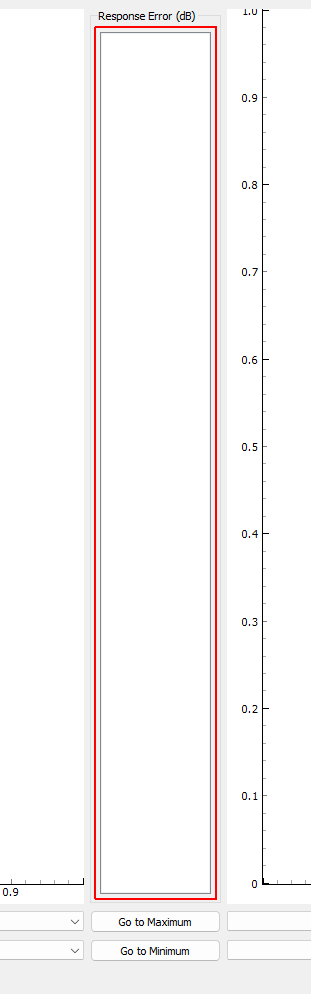
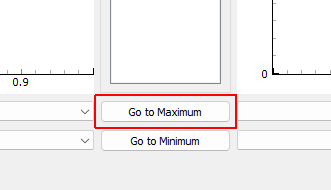
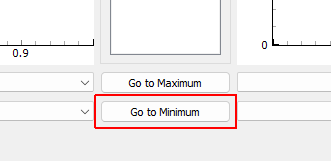
Go to Maximum Excitation Shows the excitation channel with the largest voltage
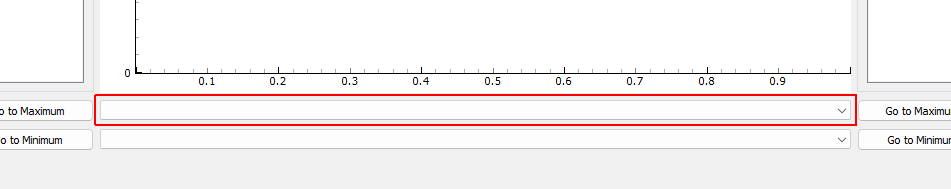
Excitation CPSD Row Channel Select the row of the excitation CPSD matrix to visualize
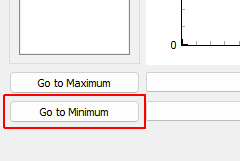
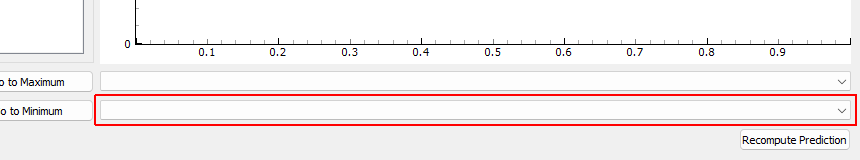
Go to Minimum Excitation Shows the excitation channel with the smallest voltage
Excitation CPSD Column Channel Select the column of the excitation CPSD matrix to visualize
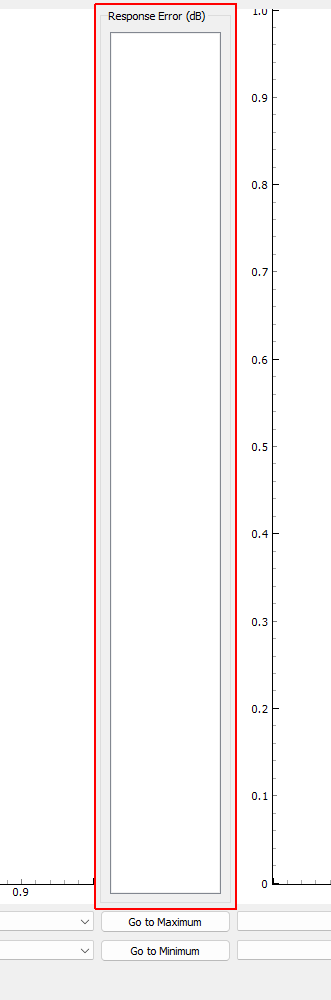
Response Error (dB) RMS dB error predicted at each control channel. Channels will be highlighted yellow if they hit a warning limit and red if they hit an abort limit. Double clicking on an item will show its response prediction.
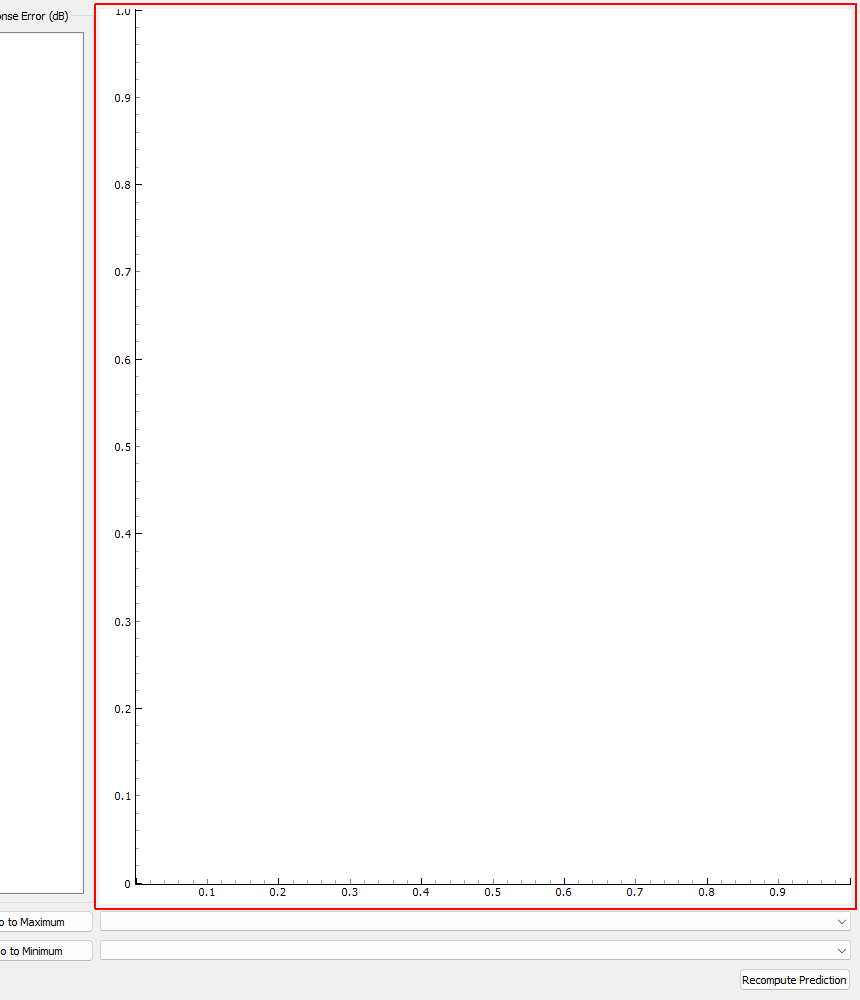
Response Prediction Display Plot Shows the specified portion of the response CPSD matrix predicted using the computed excitation CPSD and system identification information compared to the specification. If an off-diagonal term is selected, both real and imaginary parts will be plotted.
Go to Maximum Response Error Show the control channel prediction with the largest predicted error
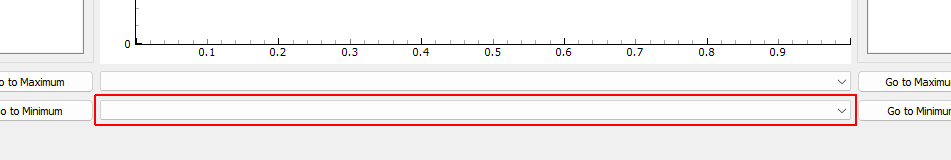
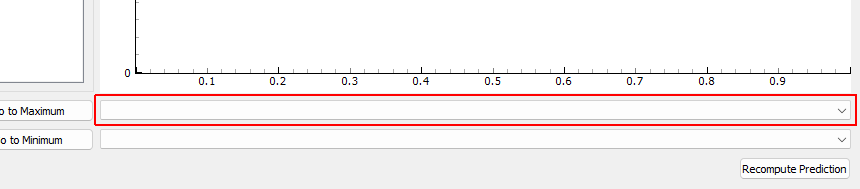
Response CPSD Row Channel Select the row of the response CPSD matrix to visualize
Go to Minimum Response Error Show the control channel prediction with the smallest predicted error
Response CPSD Column Channel Select the column of the response CPSD matrix to visualize
Recompute Prediction Click to recompute the prediction by running the control law again.
Output Voltages (RMS) Settings
Output Voltage (RMS) RMS Voltage predicted for each excitation channel
Excitation Display Plot Shows the specified portion of the CPSD matrix. If an off-diagonal term is selected, both real and imaginary parts will be plotted.
Go to Maximum Excitation Shows the excitation channel with the largest voltage
Excitation CPSD Row Channel Select the row of the excitation CPSD matrix to visualize
Go to Minimum Excitation Shows the excitation channel with the smallest voltage
Excitation CPSD Column Channel Select the column of the excitation CPSD matrix to visualize
Response Error (dB) Settings
Response Error (dB) RMS dB error predicted at each control channel. Channels will be highlighted yellow if they hit a warning limit and red if they hit an abort limit. Double clicking on an item will show its response prediction.
Response Prediction Display Plot Shows the specified portion of the response CPSD matrix predicted using the computed excitation CPSD and system identification information compared to the specification. If an off-diagonal term is selected, both real and imaginary parts will be plotted.
Go to Maximum Response Error Show the control channel prediction with the largest predicted error
Response CPSD Row Channel Select the row of the response CPSD matrix to visualize
Go to Minimum Response Error Show the control channel prediction with the smallest predicted error
Response CPSD Column Channel Select the column of the response CPSD matrix to visualize
Recompute Prediction Click to recompute the prediction by running the control law again.