This document is autogenerated from generate_ui_documentation.py. Do not edit this document directly.
Output Voltages (Peak) Displays the peak voltage that will be supplied to each of the excitation channels in the environment based on the prescribed control law.
Output Voltage Prediction Plot Displays the selected voltage signal that will be output to the excitation devices to achieve the desired response signals.
Go to Maximum Voltage Select the excitation signal with the largest peak voltage and display it in the Output Voltage Prediction plot.
Output Signal Selector Select which signal should be plotted on the Output Voltage Prediction Plot.
Go to Minimum Voltage Select the excitation signal with the smallest peak voltage and display it in the Output Voltage Prediction plot.
Response Error (TRAC) Time Response Assurance Criterion between the predicted response and the desired response. Note that the TRAC may be sensitive to small time delays in the signal, so a poor TRAC value does not immediately mean a terrible test.
Response Prediction Plot Displays the selected response signal. Both the desired time signal and the predicted time signal will be plotted.
Go to Maximum TRAC Select the response signal with the largest TRAC and display it in the Response Prediction plot.
Response Signal Selector Select which signal should be plotted on the Response Prediction Plot.
Go to Minimum TRAC Select the response signal with the smallest TRAC and display it in the Response Prediction plot.
Recompute Predictions Recompute predictions by running the control law again. If a closed loop control law is implemented, the previous predictions will be used as the “measured” data and a closed-loop update will be performed.
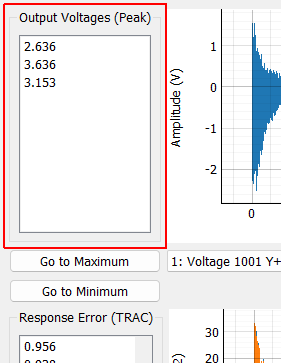
Output Voltages (Peak)
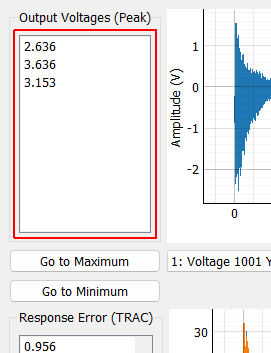
Output Voltages (Peak) Displays the peak voltage that will be supplied to each of the excitation channels in the environment based on the prescribed control law.
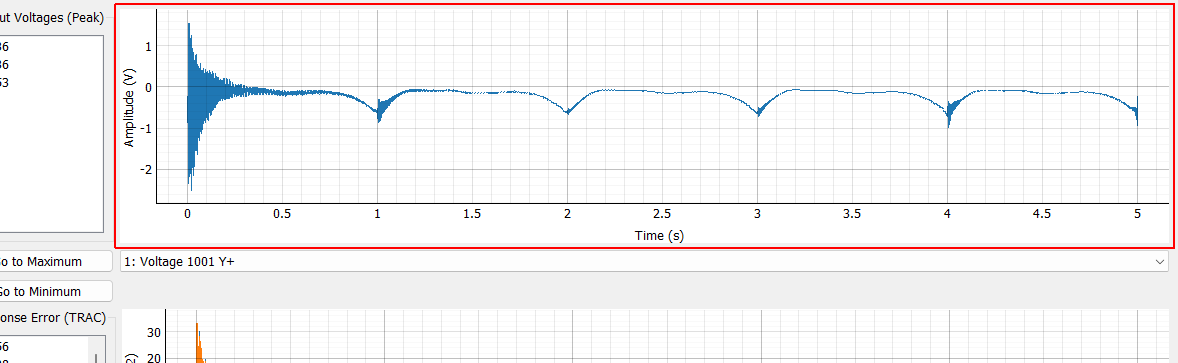
Output Voltage Prediction Plot Displays the selected voltage signal that will be output to the excitation devices to achieve the desired response signals.
Go to Maximum Voltage Select the excitation signal with the largest peak voltage and display it in the Output Voltage Prediction plot.
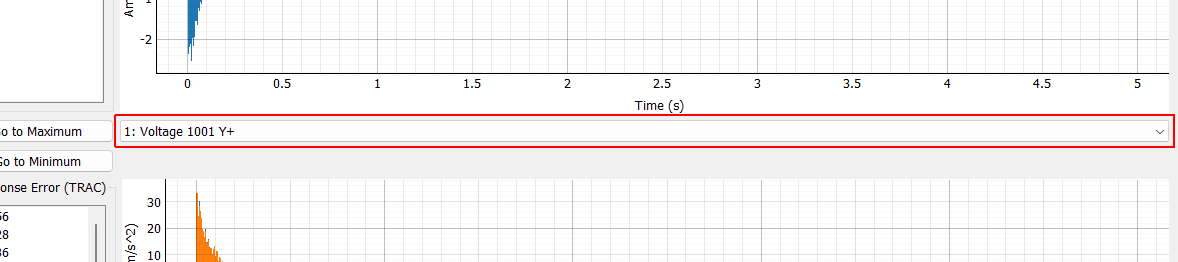
Output Signal Selector Select which signal should be plotted on the Output Voltage Prediction Plot.
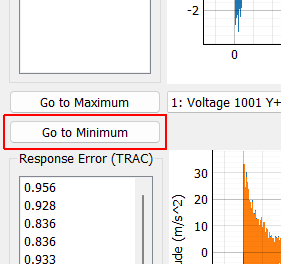
Go to Minimum Voltage Select the excitation signal with the smallest peak voltage and display it in the Output Voltage Prediction plot.
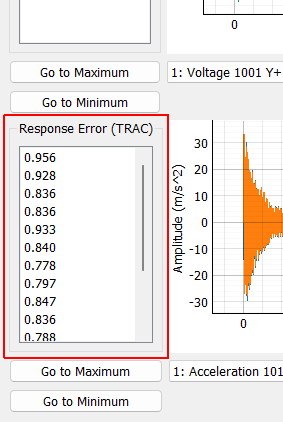
Response Error (TRAC)
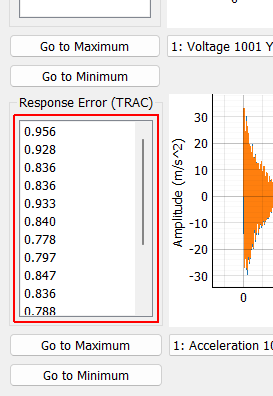
Response Error (TRAC) Time Response Assurance Criterion between the predicted response and the desired response. Note that the TRAC may be sensitive to small time delays in the signal, so a poor TRAC value does not immediately mean a terrible test.
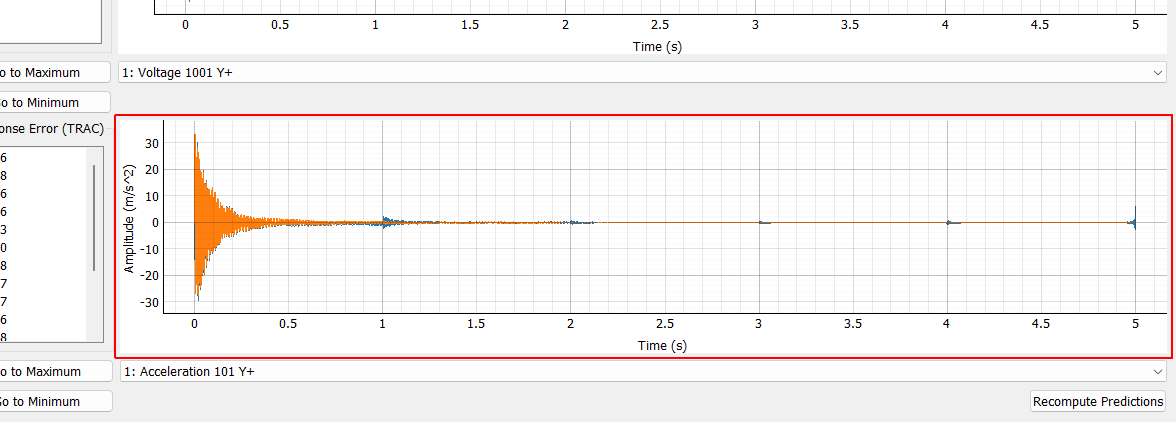
Response Prediction Plot Displays the selected response signal. Both the desired time signal and the predicted time signal will be plotted.
Go to Maximum TRAC Select the response signal with the largest TRAC and display it in the Response Prediction plot.

Response Signal Selector Select which signal should be plotted on the Response Prediction Plot.
Go to Minimum TRAC Select the response signal with the smallest TRAC and display it in the Response Prediction plot.
Recompute Predictions Recompute predictions by running the control law again. If a closed loop control law is implemented, the previous predictions will be used as the “measured” data and a closed-loop update will be performed.