This document is autogenerated from generate_ui_documentation.py. Do not edit this document directly.
Peak Response Error (dB) Displays the maximum error between the specification and the predicted or measured SRS in decibels.
Output Voltages (Peak) Displays the peak voltages that will be played to the shaker amplifiers for each drive channel.
Test Level Sets the current test level in dB. 0 dB is the actual test level from the specification. Negative values reduce the shock level; positive values increase it.
Target Hits at Level The number of hits desired at the current test level. If Automatic Hits is used, the measurement will stop after the target number of hits is reached.
Current Hits at Level Displays the current number of hits that have been performed at the current test level.
Current Total Hits Displays the total number of hits performed at any test level.
Progress Bar When automatic impacts are performed, it displays the progress towards the target number of hits at this level.
Manual Hits If selected, the controller will play one shock each time the Start Environment button is pressed.
Automatic Hits If selected, the controller will continue to hit the test article until the Target Hits at Level is reached.
SDS Table Opens up the sum-of-decayed-sines table dialog box, which allows the user to modify the sum-of-decayed-sines parameters manually, make predictions, and view measured data.
Shock History Opens the shock history dialog which shows a history of all shocks applied to the test article.
Start Environment Starts the environment controlling to the specification. Will perform a single hit in manual mode or several hits up to the target hits at level in automatic mode.
Stop Environment Stops the environment prematurely when operating in automatic hit mode.
Save Current Control Data Saves the control data, including specified and measured SRS, to a NumPy, Matlab, or NetCDF4 file.
Global Control Response Displays the measured shock response spectra for all control channels.
Control Channel Selector Specifies the channel for which a SRS or Time History plot will be created.
Create SRS Window Creates a window displaying the specified and measured SRS for the selected channel.
Create Time History Window Creates a window displaying the measured time history for the selected channel.
Show All SRS Channels Creates an SRS window for each control channel in the test and then tiles the windows across the main monitor.
Show All Time Channels Creates a window showing the time response for all control channels and tiles them across the main monitor.
Tile All Windows Tiles all existing windows over the main monitor
Close All Windows Close all existing SRS or Time History windows.
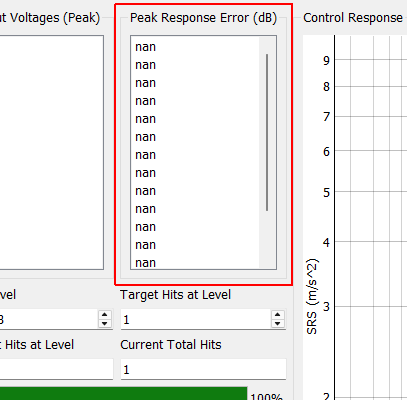
Peak Response Error (dB)
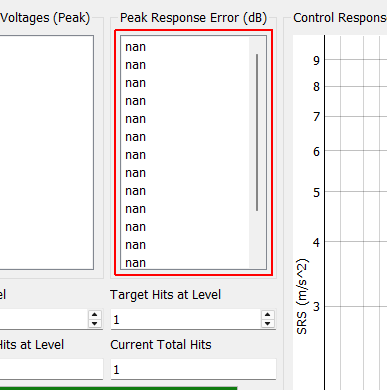
Peak Response Error (dB) Displays the maximum error between the specification and the predicted or measured SRS in decibels.
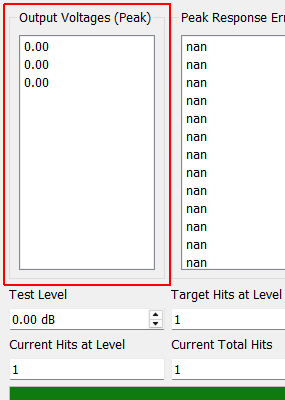
Output Voltages (Peak)
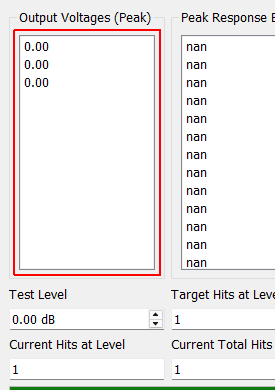
Output Voltages (Peak) Displays the peak voltages that will be played to the shaker amplifiers for each drive channel.
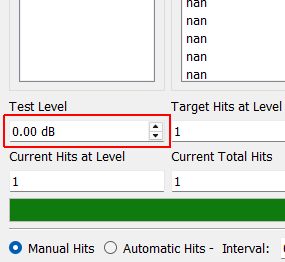
Test Level Sets the current test level in dB. 0 dB is the actual test level from the specification. Negative values reduce the shock level; positive values increase it.
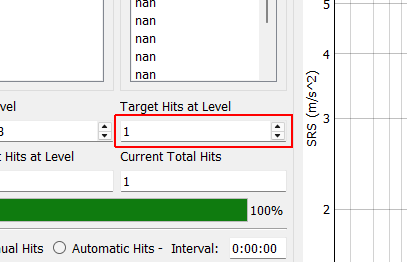
Target Hits at Level The number of hits desired at the current test level. If Automatic Hits is used, the measurement will stop after the target number of hits is reached.
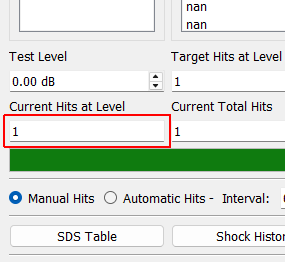
Current Hits at Level Displays the current number of hits that have been performed at the current test level.
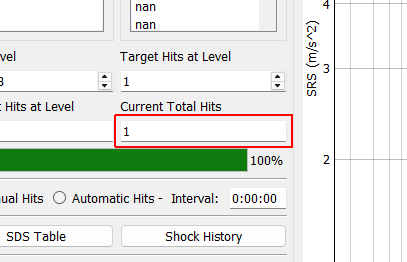
Current Total Hits Displays the total number of hits performed at any test level.
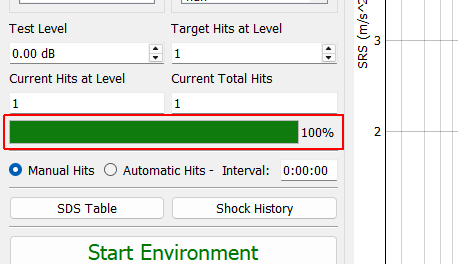
Progress Bar When automatic impacts are performed, it displays the progress towards the target number of hits at this level.
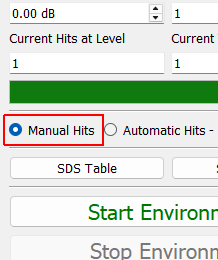
Manual Hits If selected, the controller will play one shock each time the Start Environment button is pressed.
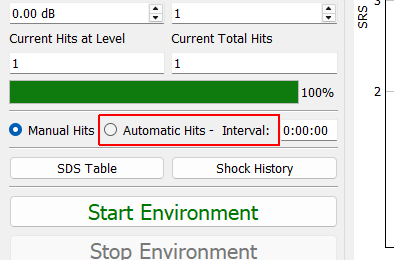
Automatic Hits If selected, the controller will continue to hit the test article until the Target Hits at Level is reached.
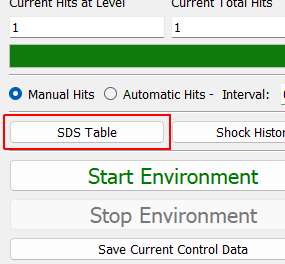
SDS Table Opens up the sum-of-decayed-sines table dialog box, which allows the user to modify the sum-of-decayed-sines parameters manually, make predictions, and view measured data.
Shock History Opens the shock history dialog which shows a history of all shocks applied to the test article.
Start Environment Starts the environment controlling to the specification. Will perform a single hit in manual mode or several hits up to the target hits at level in automatic mode.
Stop Environment Stops the environment prematurely when operating in automatic hit mode.
Save Current Control Data Saves the control data, including specified and measured SRS, to a NumPy, Matlab, or NetCDF4 file.
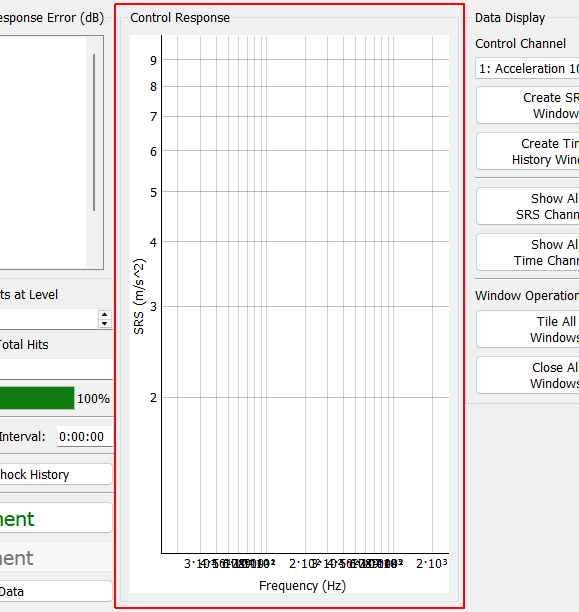
Control Response
Global Control Response Displays the measured shock response spectra for all control channels.
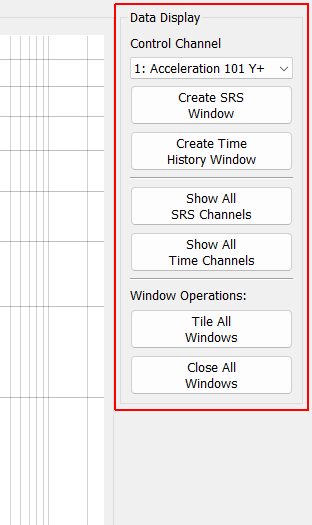
Data Display
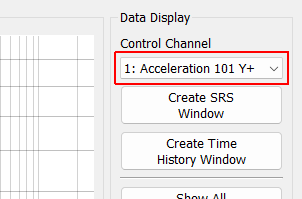
Control Channel Selector Specifies the channel for which a SRS or Time History plot will be created.
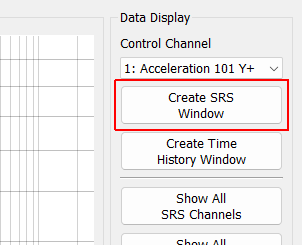
Create SRS Window Creates a window displaying the specified and measured SRS for the selected channel.
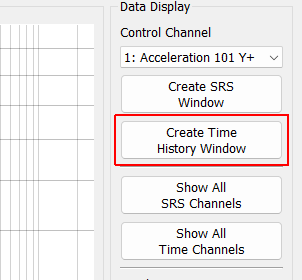
Create Time History Window Creates a window displaying the measured time history for the selected channel.
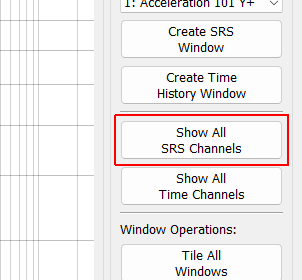
Show All SRS Channels Creates an SRS window for each control channel in the test and then tiles the windows across the main monitor.
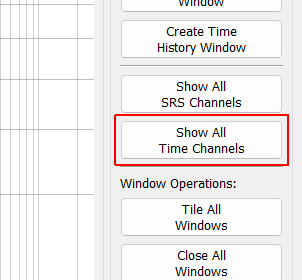
Show All Time Channels Creates a window showing the time response for all control channels and tiles them across the main monitor.
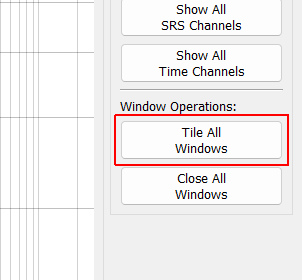
Tile All Windows Tiles all existing windows over the main monitor
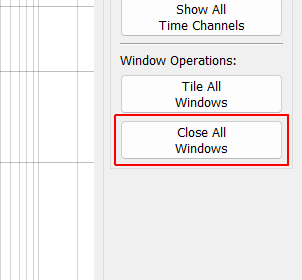
Close All Windows Close all existing SRS or Time History windows.
Output Voltages (Peak) Maximum output voltage that will be sent to the shaker to generate the sum-of-decayed-sines signals.
Go to Maximum Voltage Changes the voltage plot to show the excitation signal that reaches the largest maximum value.
Go to Minimum Voltage Changes the voltage plot to show the excitation signal that reaches the smallest maximum value.
Sum of Decayed Sines Table Table showing sum-of-decayed-sines parameters used to generate the output voltage signals.
Excitation Display Displays the time history of the selected voltage signal generated from the sum-of-decayed-sines parameters.
Excitation Selector Specifies the excitation voltage channel to display in the plot.
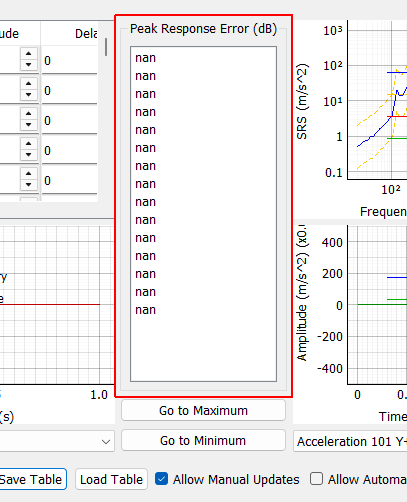
Peak Response Error (dB) Displays the maximum error between the specified SRS and the predicted or measured SRS in decibels.
Go to Maximum Error Changes the response plots to show the control signal that has the largest maximum error.
Go to Minimum Error Changes the response plots to show the control signal that has the smallest maximum error.
Control SRS Plot Displays the SRS for the specification as well as the predicted and measured signals.
Control Time History Plot Displays the time for the predicted and measured response signals.
Response Selector Selects the control channel that will be displayed on the response plots.
Save Table Saves the current sum-of-decayed-sines table to a NumPy, CSV, or Excel file.
Load Table Loads a sum-of-decayed-sines table from a NumPy, CSV, or Excel file.
Allow Manual Updates If selected, the user can manually update the sum-of-decayed-sines parameters by modifying values in the table. If not selected, the user cannot change these parameters.
Allow Automatic Updates If selected, the control law will be run after each impact to potentially update the sum-of-decayed-sines parameters automatically.
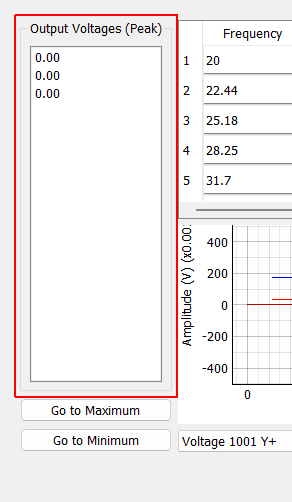
Output Voltages (Peak)
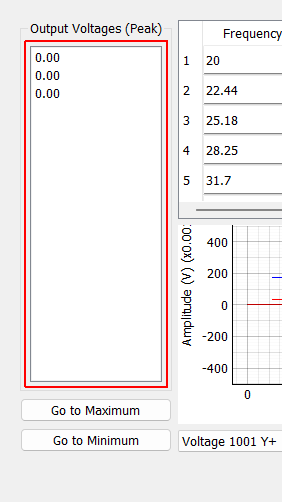
Output Voltages (Peak) Maximum output voltage that will be sent to the shaker to generate the sum-of-decayed-sines signals.
Go to Maximum Voltage Changes the voltage plot to show the excitation signal that reaches the largest maximum value.
Go to Minimum Voltage Changes the voltage plot to show the excitation signal that reaches the smallest maximum value.
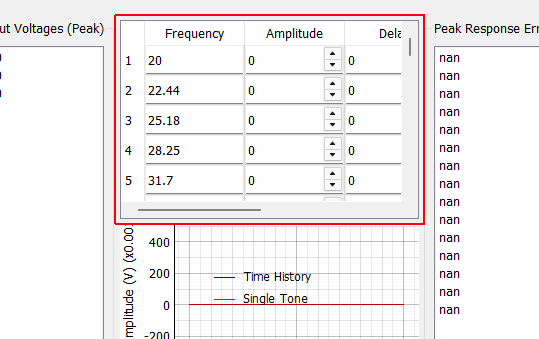
Sum of Decayed Sines Table Table showing sum-of-decayed-sines parameters used to generate the output voltage signals.
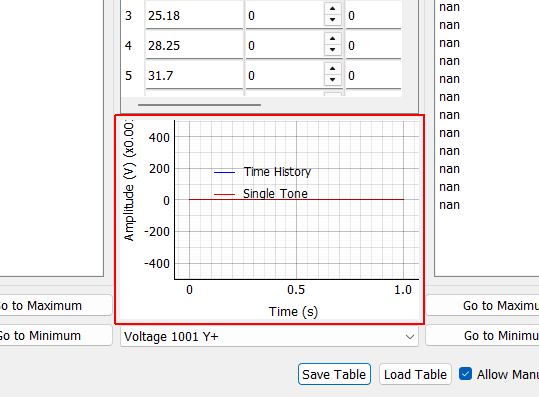
Excitation Display Displays the time history of the selected voltage signal generated from the sum-of-decayed-sines parameters.
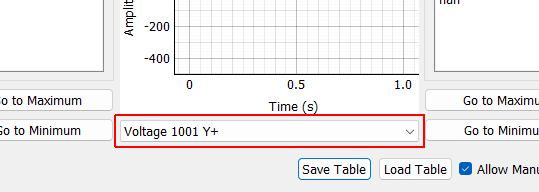
Excitation Selector Specifies the excitation voltage channel to display in the plot.
Peak Response Error (dB)
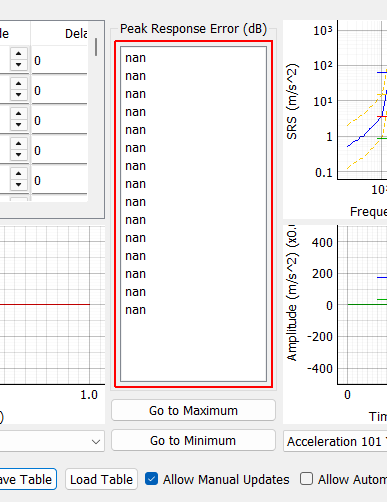
Peak Response Error (dB) Displays the maximum error between the specified SRS and the predicted or measured SRS in decibels.
Go to Maximum Error Changes the response plots to show the control signal that has the largest maximum error.
Go to Minimum Error Changes the response plots to show the control signal that has the smallest maximum error.
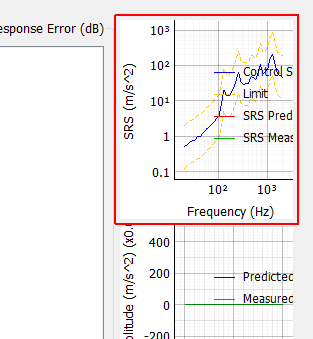
Control SRS Plot Displays the SRS for the specification as well as the predicted and measured signals.
Control Time History Plot Displays the time for the predicted and measured response signals.
Response Selector Selects the control channel that will be displayed on the response plots.
Save Table Saves the current sum-of-decayed-sines table to a NumPy, CSV, or Excel file.
Load Table Loads a sum-of-decayed-sines table from a NumPy, CSV, or Excel file.
Allow Manual Updates If selected, the user can manually update the sum-of-decayed-sines parameters by modifying values in the table. If not selected, the user cannot change these parameters.
Allow Automatic Updates If selected, the control law will be run after each impact to potentially update the sum-of-decayed-sines parameters automatically.
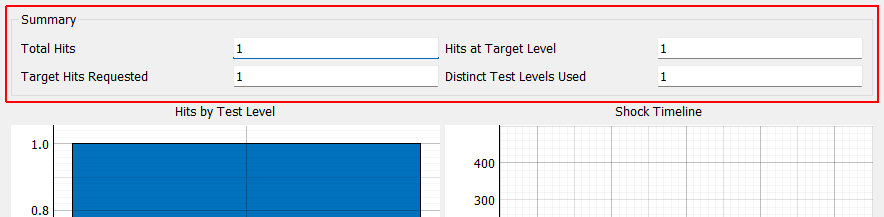
Total Hits Shows the total number of hits applied to the test article.
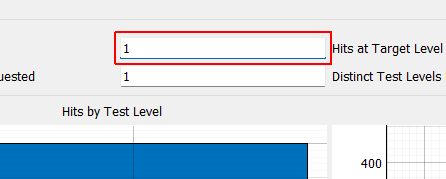
Hits at Target Level Displays the total number of hits that were performed at or above the target test level.
Target Hits Requested The total number of hits that were requeted at the target test level by the specification.
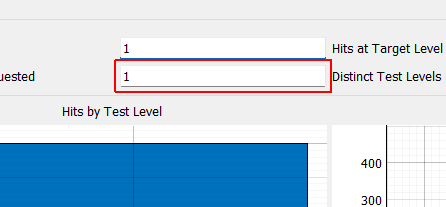
Distinct Test Levels Used Displays the total number of different levels used to impact the test article.
Hit by Test Level Histogram Presents a histogram to display how many hits have been performed at each test level.
Shock Timeline Shows the test level used for each impact.
Close Closes the dialog box.
Show Detailed Hit Table If checked, a detailed hit table containing test level, time stamp, and other information is displayed.
Summary
Total Hits Shows the total number of hits applied to the test article.
Hits at Target Level Displays the total number of hits that were performed at or above the target test level.
Target Hits Requested The total number of hits that were requeted at the target test level by the specification.
Distinct Test Levels Used Displays the total number of different levels used to impact the test article.
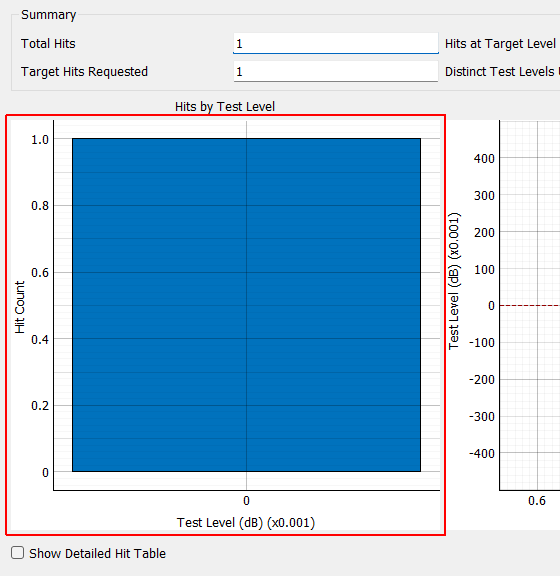
Hit by Test Level Histogram Presents a histogram to display how many hits have been performed at each test level.
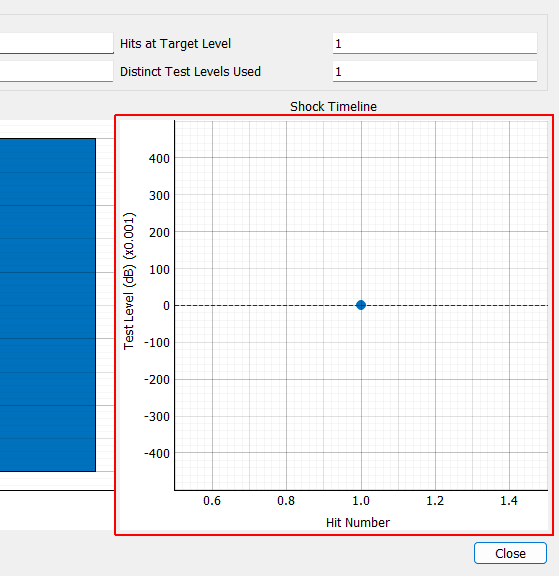
Shock Timeline Shows the test level used for each impact.
Close Closes the dialog box.
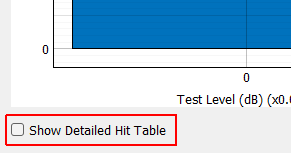
Show Detailed Hit Table If checked, a detailed hit table containing test level, time stamp, and other information is displayed.
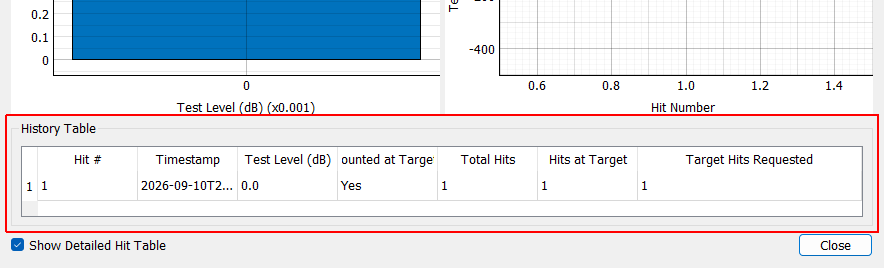
History Table A detailed hit table containing each impact, its test level, the time stamp, and other information.
History Table
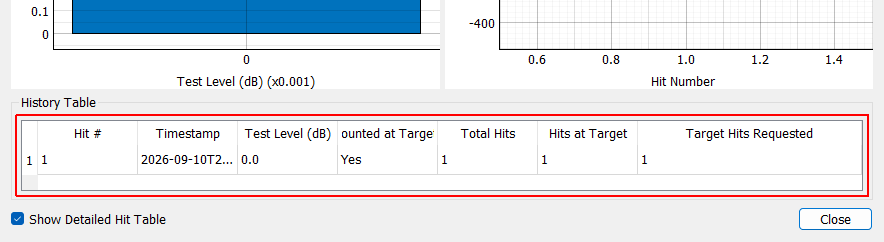
History Table A detailed hit table containing each impact, its test level, the time stamp, and other information.