Larval Transport Analysis (Velocity)
This set of inputs evaluates the impact on larval motility given a single critical velocity receptor in a CSV file.
Input
At this point you should have already setup the input files and style files as detailed in Prepare Tutorial Files.
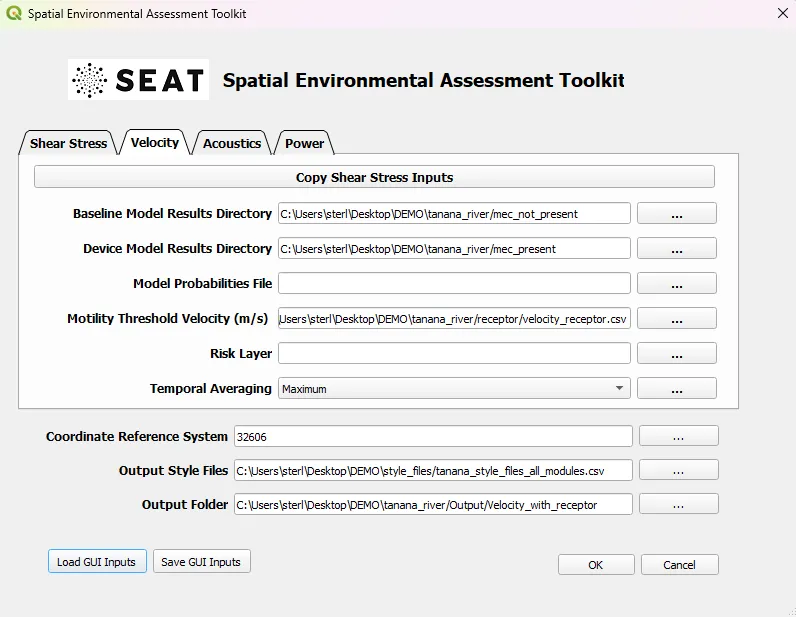
To run this demonstration, use the Load GUI Inputs button located at the bottom left of the SEAT GUI, navigate to DEMO/tanana_river/velocity_with_receptor.ini, and click OK to load the inputs. If you need detailed instructions on how to load inputs, please refer to the Save & Load Configuration section in the SEAT QGIS Plugin documention.
In brief, the model data consists of individual .nc files for each flow return period. The period within the .nc filename determines the probability of occurrence. There is a set of results for no device and a set of results for 9 devices in the river.
Note
Your paths will differ from the ones shown in the example below. If you get an error double check the paths making sure the files exist at the specified location.
Output
For this case the velocity with devices is compared to the velocity without devices and a difference (stressor) is calculated.
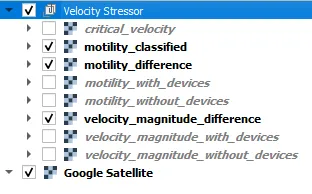
Layers Legend |
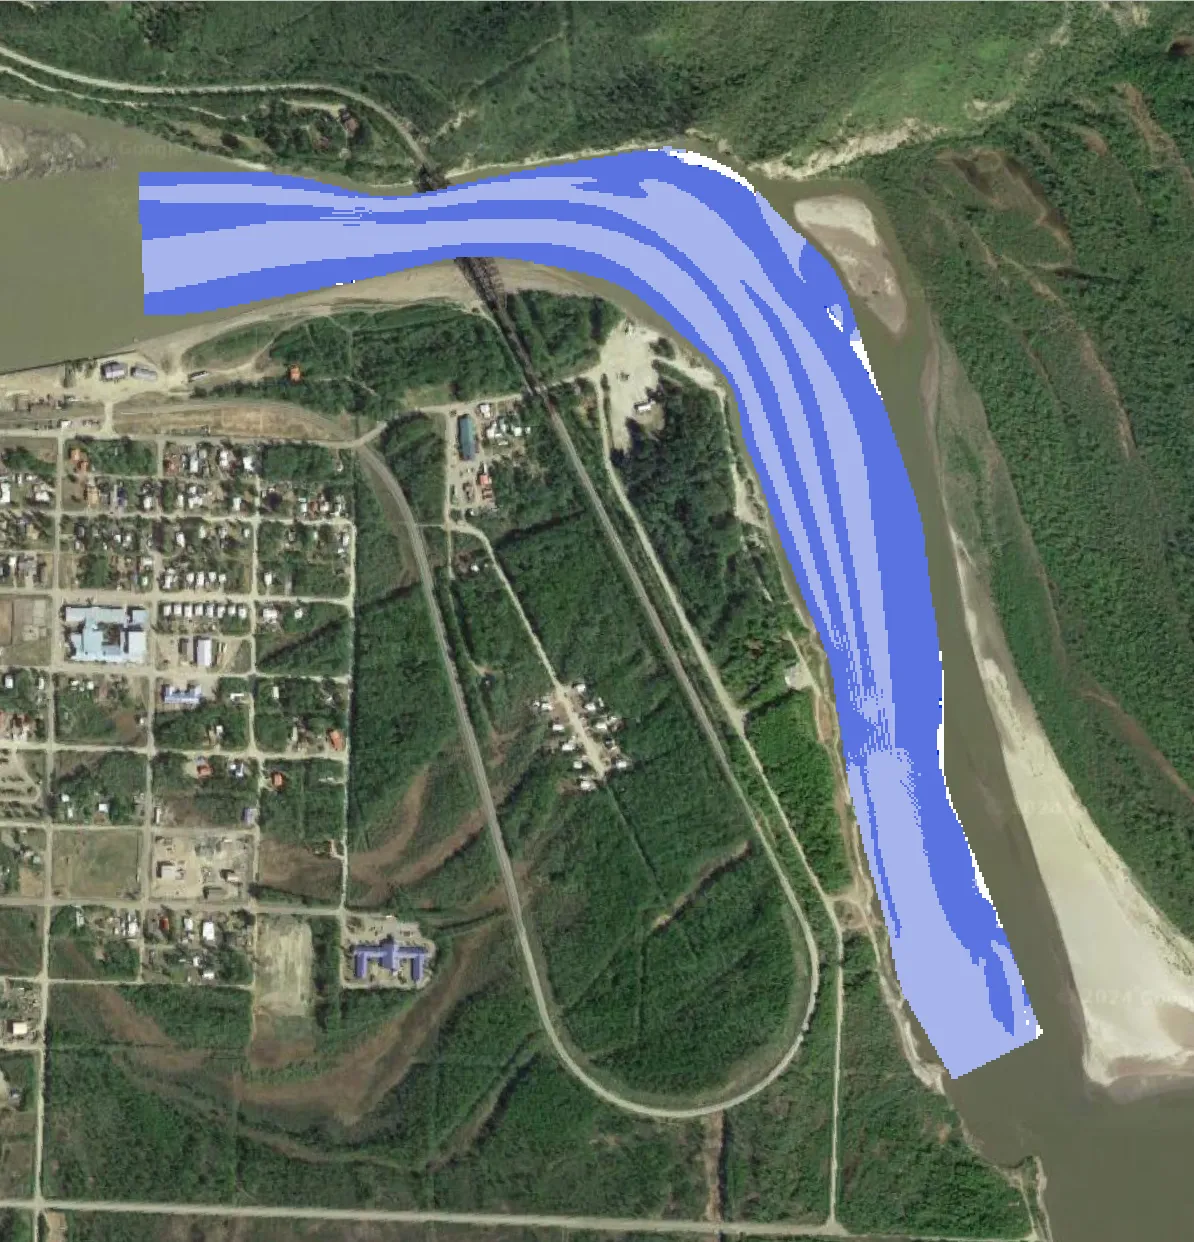
Motility Classified |
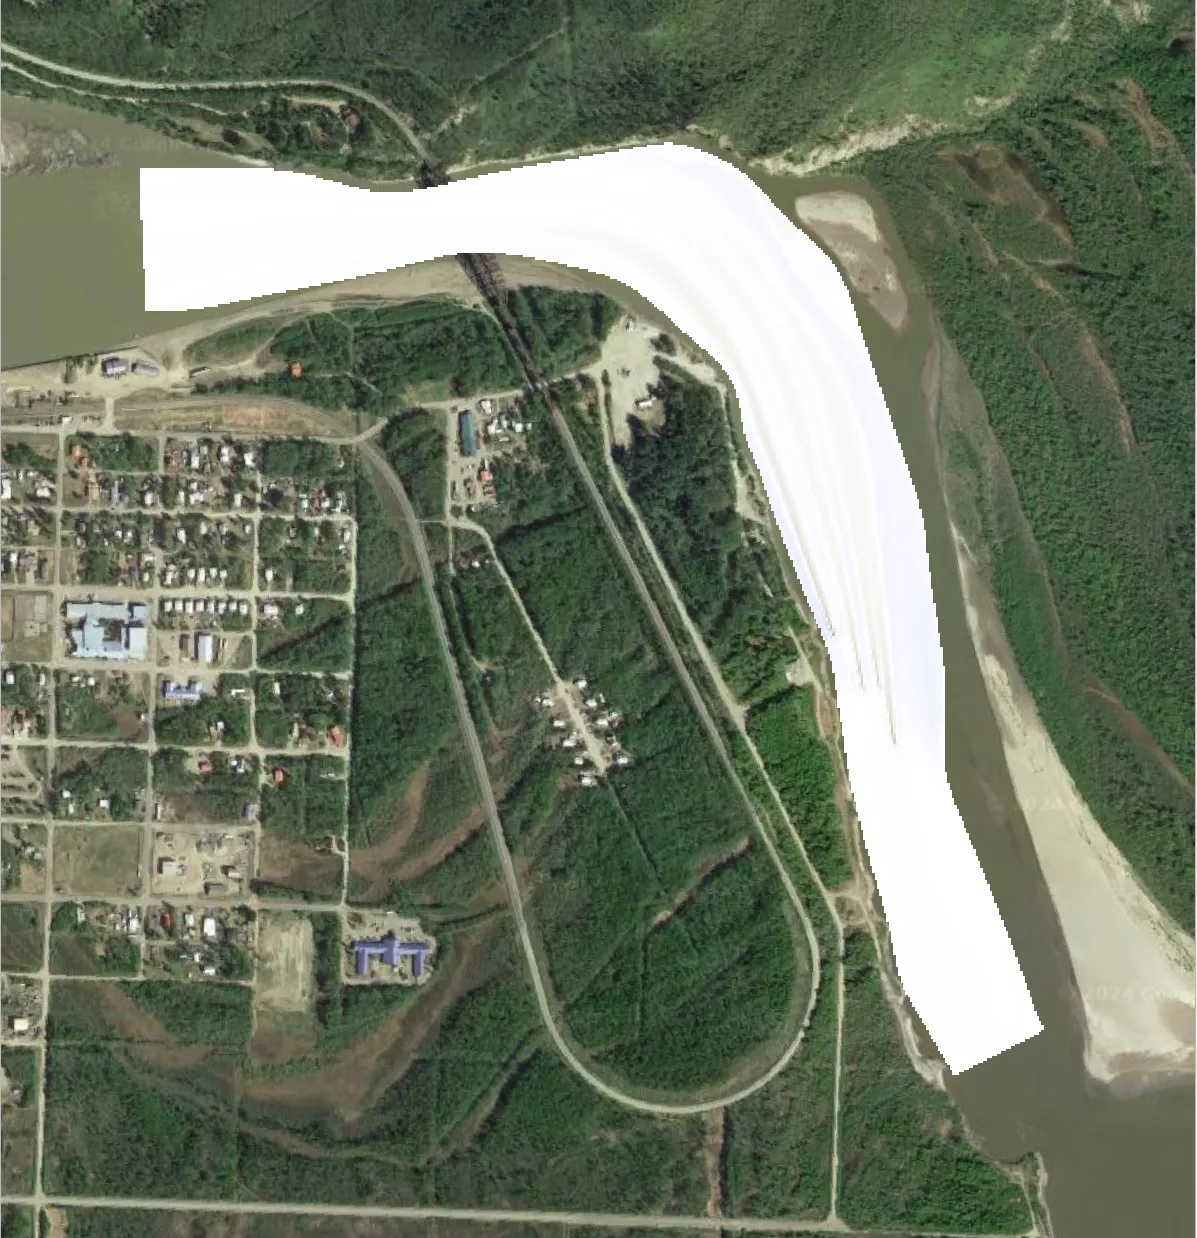
Motility Difference |
Velocity Difference |
Output Files
Additional output files can be found in the specifed Output folder.
Output
└───Velocity_with_Receptor
  └───Velocity Module
     critical_velocity.tif
     motility_classified.csv
     motility_classified.tif
     motility_classified_at_critical_velocity.csv
     motility_difference.csv
     motility_difference.tif
     motility_difference_at_critical_velocity.csv
     motility_without_devices.tif
     motility_with_devices.tif
     velocity_magnitude_difference.csv
     velocity_magnitude_difference.tif
     velocity_magnitude_difference_at_critical_velocity.csv
     velocity_magnitude_with_devices.tif