Note
Go to the end to download the full example code.
RobustWorkflow: Difficult Cases & Batch Processing
This tutorial continues the RobustWorkflow guide with the harder cases from
the robust_workflow notebook:
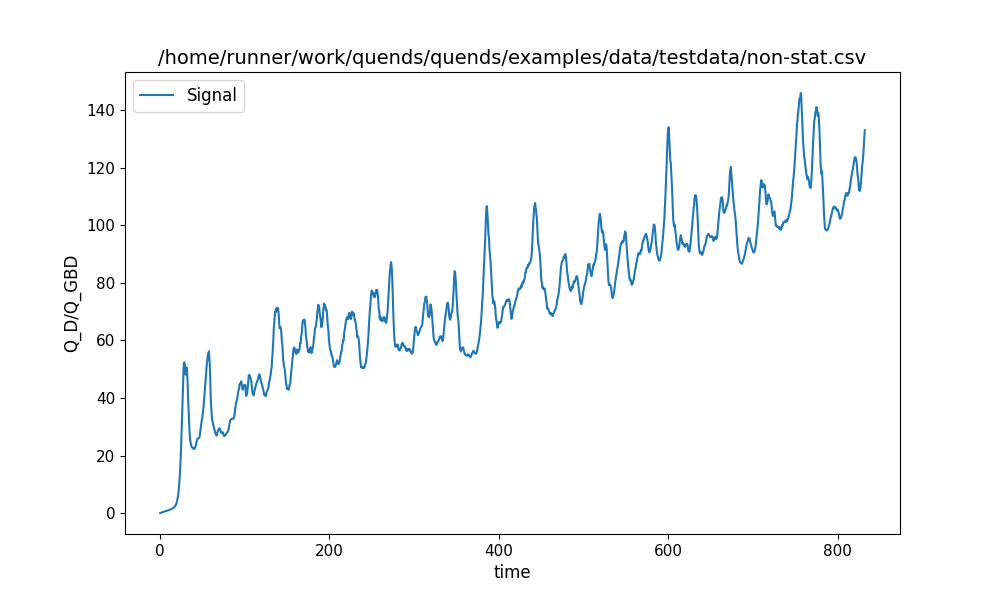
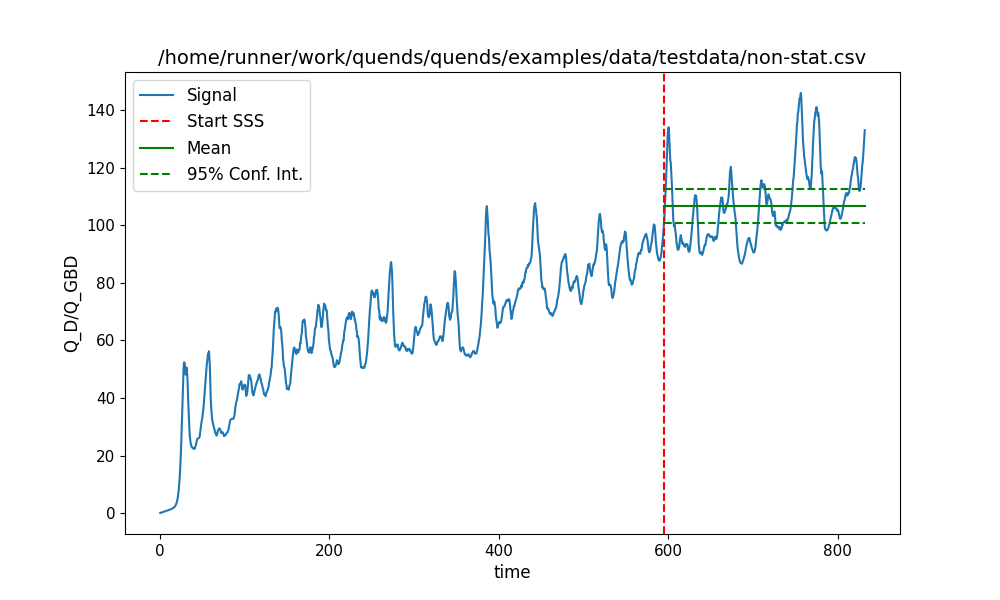
a non-stationary signal, where the workflow drops successive initial fractions until the tail is stationary,
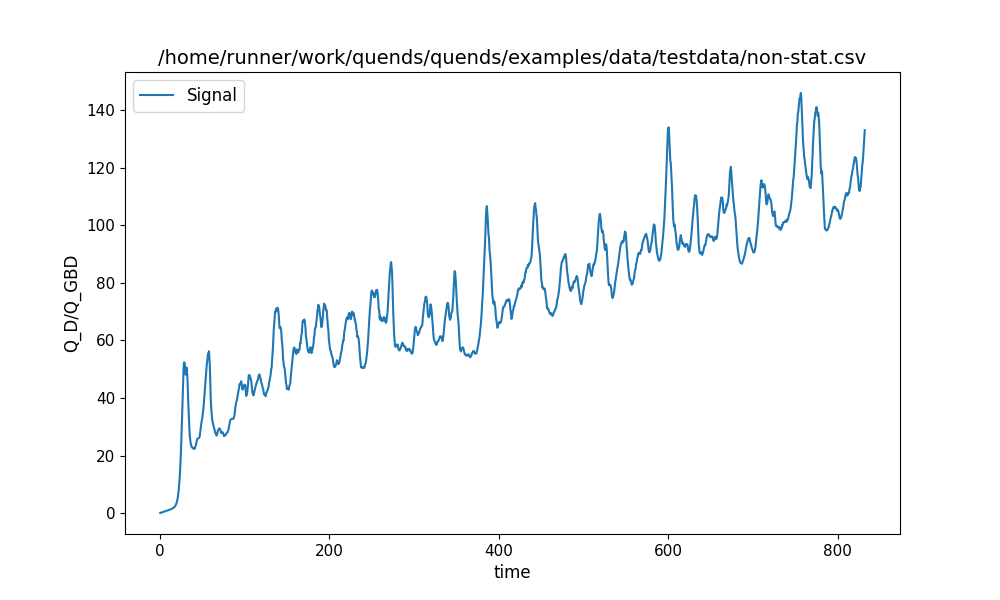
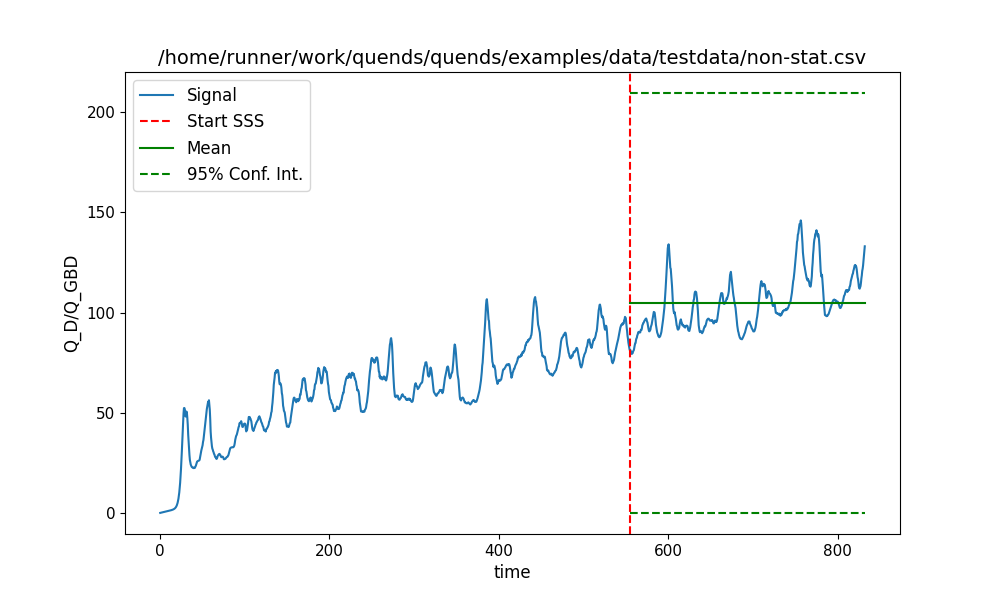
the same signal with a stricter
n_pts_min, where the workflow gives up and returns “ball-park” (AdHoc) statistics,a stationary signal with no steady state found because of deliberately bad hyperparameters, and
batch processing of several runs followed by a flux-vs-collisionality plot.
Throughout, operate_safe=False lets the workflow return a result (flagged in
metadata) instead of aborting. See the RobustWorkflow guide for the basic
single-signal procedure.
Setup
As in the basic guide, keep_figures keeps the workflow’s displayed figures
open long enough for the documentation gallery to capture them.
import contextlib
import re
from pathlib import Path

import matplotlib.pyplot as plt
import numpy as np
import pandas as pd

import quends as qnds

plotter = qnds.Plotter()


def example_data_dir() -> Path:
    """Find the shared example data directory during script or gallery runs."""
    starts = []
    if "__file__" in globals():
        starts.append(Path(__file__).resolve())
    starts.append(Path.cwd().resolve())

    for start in starts:
        for parent in [start, *start.parents]:
            for candidate in (parent / "examples" / "data", parent / "data"):
                if candidate.is_dir():
                    return candidate
    raise FileNotFoundError("Could not locate examples/data")


DATA_DIR = example_data_dir()


@contextlib.contextmanager
def keep_figures():
    _close = plt.close
    plt.close = lambda *a, **k: None
    try:
        yield
    finally:
        plt.close = _close
A signal that is not stationary
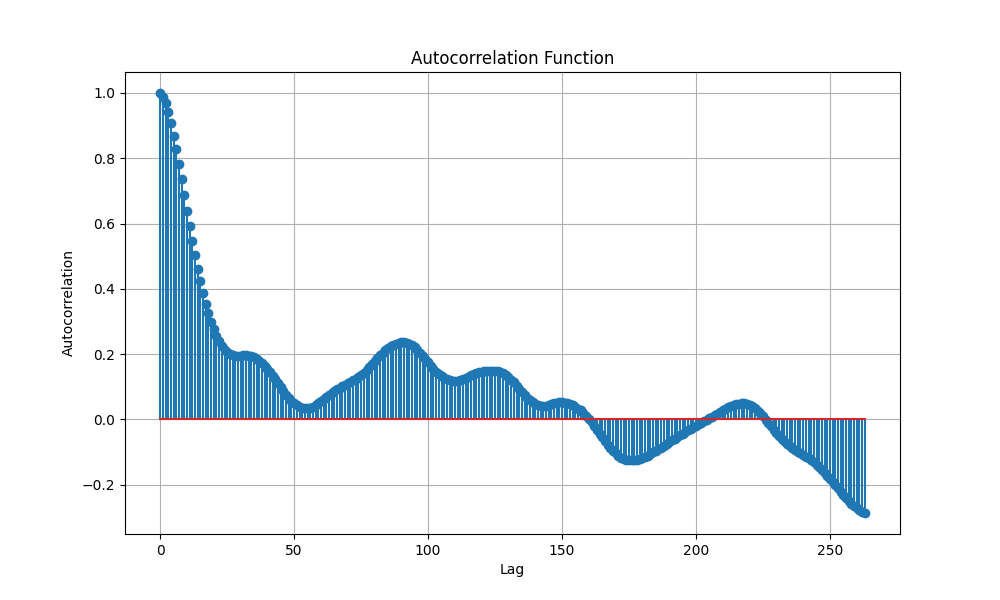
This signal was built by adding a linear trend to a stationary signal. When the full stream is analysed it is found non-stationary; rather than abort, the workflow repeatedly drops a fraction of the data (25% by default) to see whether the tail becomes stationary, and here it eventually succeeds.
data_paths = [DATA_DIR / "testdata" / "non-stat.csv"]
col = pd.read_csv(data_paths[0]).columns[2]  # 3rd column (after index, time)
data_stream = qnds.from_csv(data_paths[0], col)
print("The data stream contains the following variables:")
for column, name in enumerate(data_stream.variables()):
    print(f"{column}: {name}")

my_wrkflw = qnds.RobustWorkflow(operate_safe=False, verbosity=2)
with keep_figures():
    plotter.plot_signal_basic_stats(data_stream, col, label=data_paths[0])
    my_stats = my_wrkflw.process_data_stream(data_stream, col)
    if not my_stats[col]["metadata"]["mitigation"] == "Drop":
        plotter.plot_signal_basic_stats(
            data_stream, col, stats=my_stats, label=data_paths[0]
        )
The data stream contains the following variables:
0: time
1: Q_D/Q_GBD
Original size of data stream: 1664 points.
After enforcing start time there are 1664 points left.
Data stream is not stationary, even after dropping first 416 points.
Data stream is not stationary, even after dropping first 728 points.
Data stream is not stationary, even after dropping first 962 points.
Data stream was not stationary, but is stationary after dropping first 1137 points.
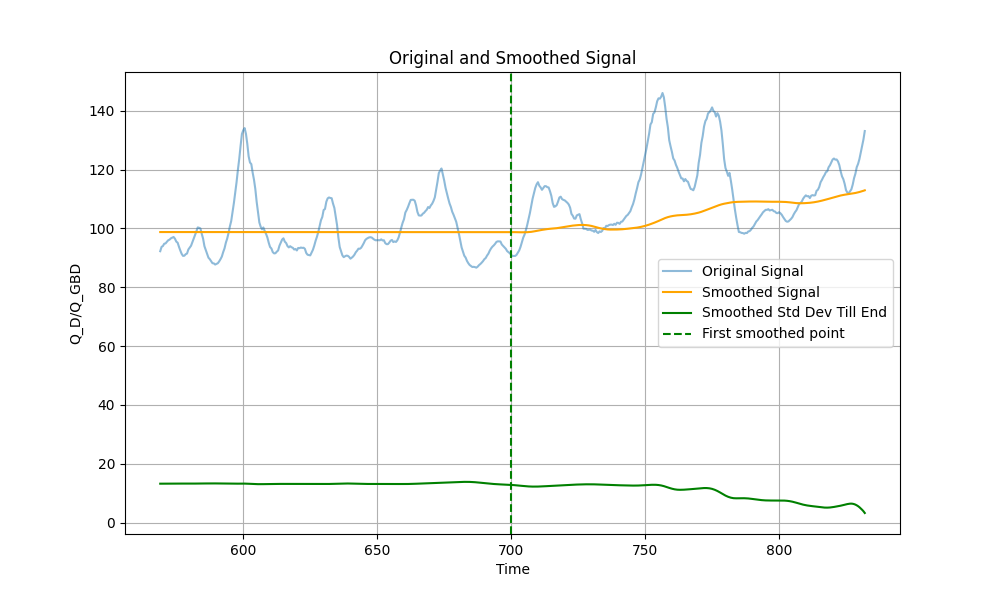
stats decorrelation time 58.16 gives smoothing window of 263 points.
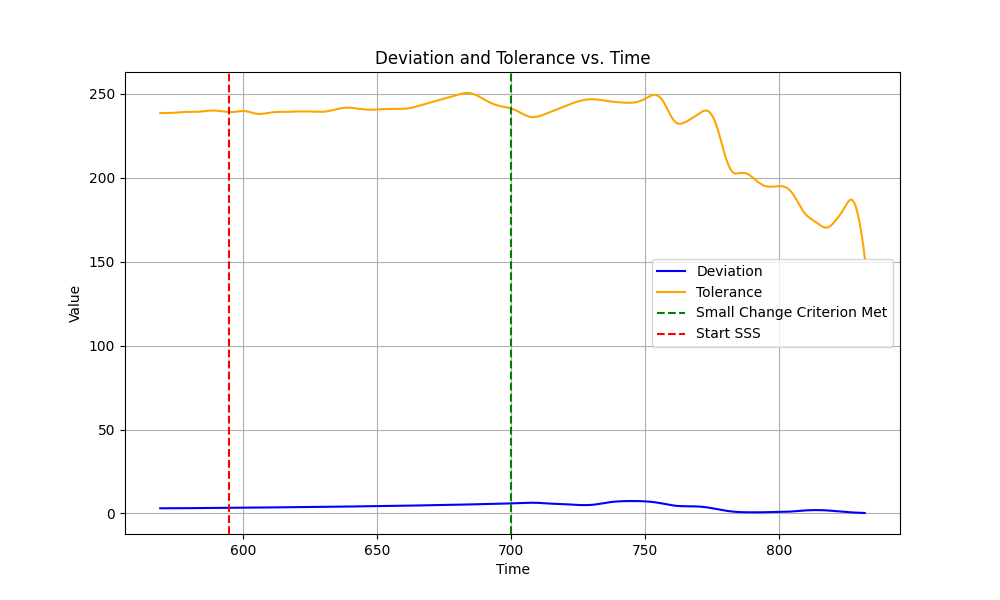
Getting start of SSS based on smoothed signal:
Index where criterion is met: 262
Rolling window: 263
time where criterion is met: 700.00
time at start of SSS (adjusted for rolling window): 634.00
print("metadata:", my_stats[col]["metadata"])
metadata: {'status': 'Regular', 'mitigation': 'None'}
… and when it should give up
With a stricter n_pts_min the workflow stops dropping data once the
remaining stream gets too short. It then declares the stream non-stationary
and – because operate_safe=False – returns ad-hoc statistics
(status: NoStatSteadyState / mitigation: AdHoc) based on the tail of
the signal, rather than failing.
my_wrkflw = qnds.RobustWorkflow(operate_safe=False, verbosity=2, n_pts_min=1000)
with keep_figures():
    plotter.plot_signal_basic_stats(data_stream, col, label=data_paths[0])
    my_stats = my_wrkflw.process_data_stream(data_stream, col)
    if not my_stats[col]["metadata"]["mitigation"] == "Drop":
        plotter.plot_signal_basic_stats(
            data_stream, col, stats=my_stats, label=data_paths[0]
        )
Original size of data stream: 1664 points.
After enforcing start time there are 1664 points left.
Data stream is not stationary, even after dropping first 416 points.
Data stream is not stationary, even after dropping first 728 points.
Data stream is not stationary.
print("metadata:", my_stats[col]["metadata"])
metadata: {'status': 'NoStatSteadyState', 'mitigation': 'AdHoc'}
Stationary, but no steady state found
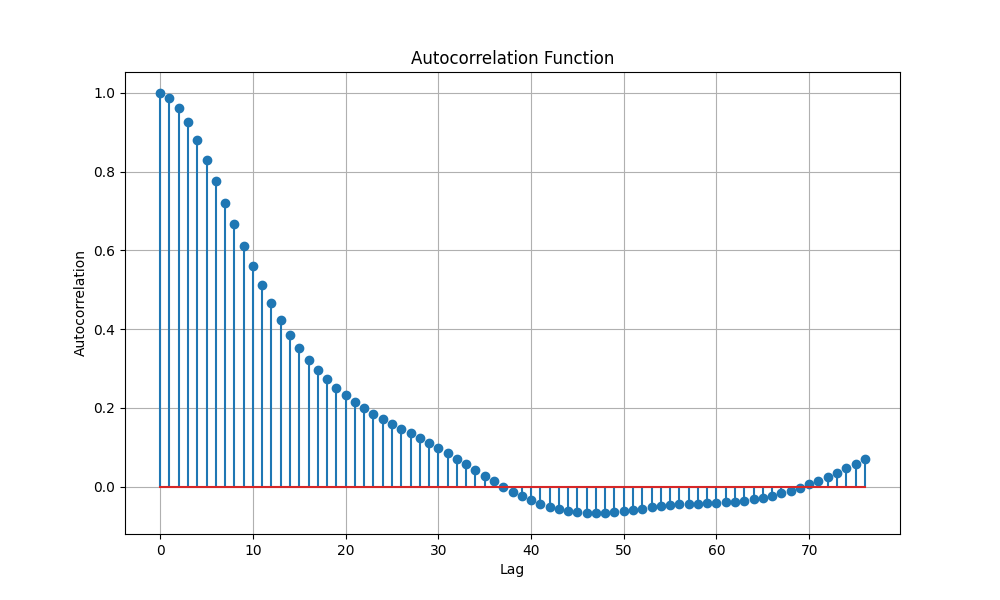
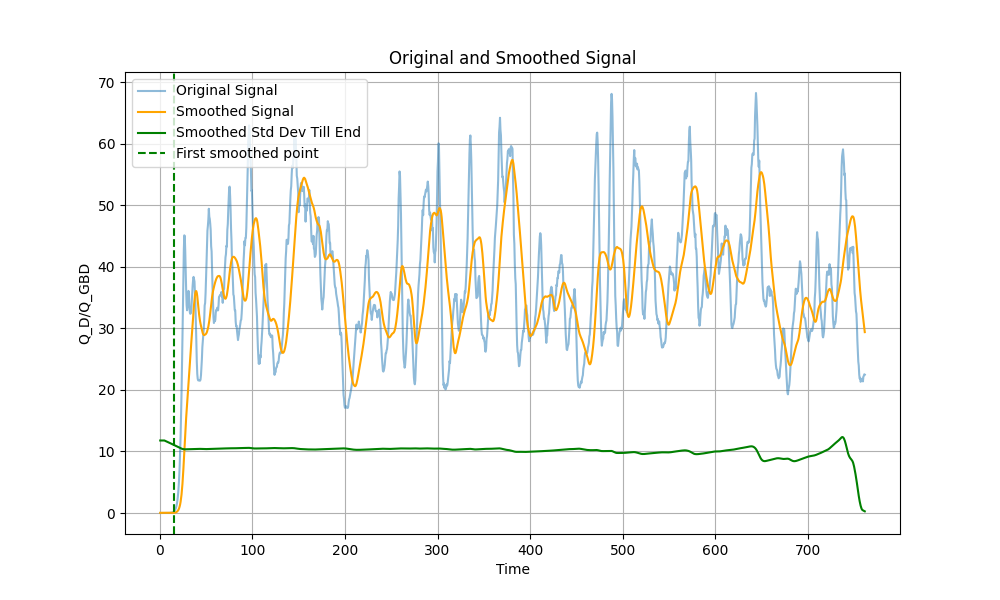
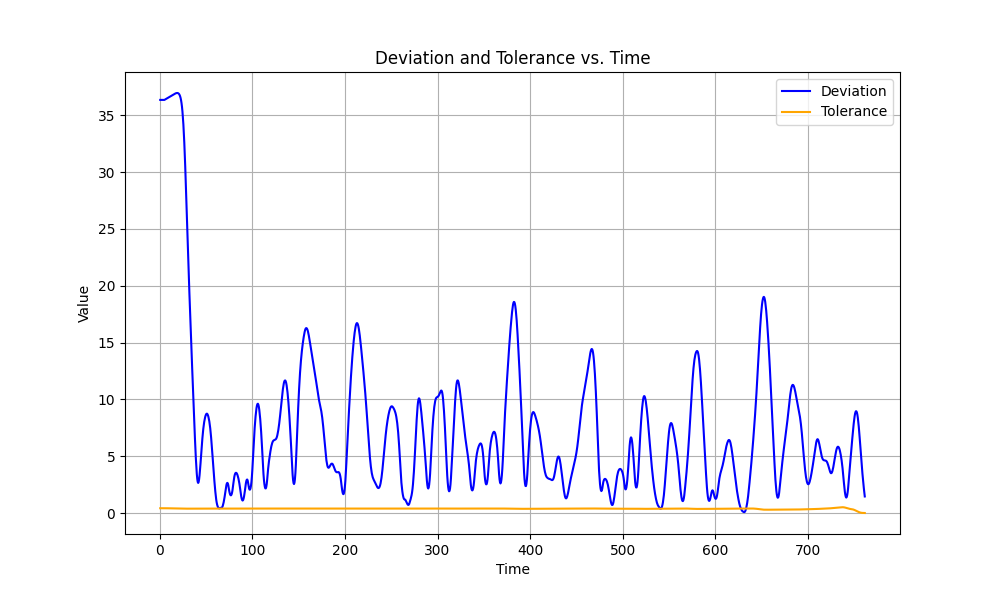
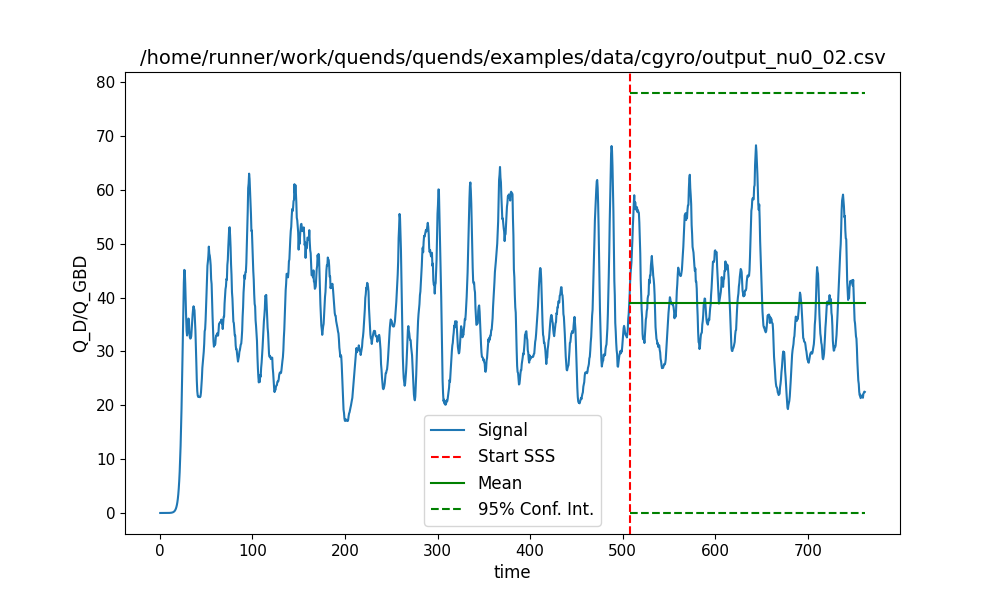
Here the data is stationary, but deliberately bad hyperparameters
(max_lag_frac=0.05, decor_multiplier=1.0, std_dev_frac=0.001,
fudge_fac=0.0) give a short averaging window and a tiny deviation
tolerance, so no SSS segment can be found. An ad-hoc result (based on the last
third of the signal) is returned instead.
data_path = DATA_DIR / "cgyro" / "output_nu0_02.csv"
ds0 = qnds.from_csv(data_path, "Q_D/Q_GBD")
col = "Q_D/Q_GBD"
my_wrkflw0 = qnds.RobustWorkflow(
    operate_safe=False,
    verbosity=2,
    max_lag_frac=0.05,
    decor_multiplier=1.0,
    std_dev_frac=0.001,
    fudge_fac=0.0,
)
with keep_figures():
    my_stats0 = my_wrkflw0.process_data_stream(ds0, col)
    if not my_stats0[col]["metadata"]["mitigation"] == "Drop":
        plotter.plot_signal_basic_stats(ds0, col, my_stats0, label=data_path)
Original size of data stream: 1523 points.
After enforcing start time there are 1523 points left.
stats decorrelation time 27.57 gives smoothing window of 27 points.
Getting start of SSS based on smoothed signal:
No SSS found based on behavior of mean of smoothed signal.
No statistical steady state found after trimming.
print("metadata:", my_stats0[col]["metadata"])
metadata: {'status': 'NoStatSteadyState', 'mitigation': 'AdHoc'}
Batch processing
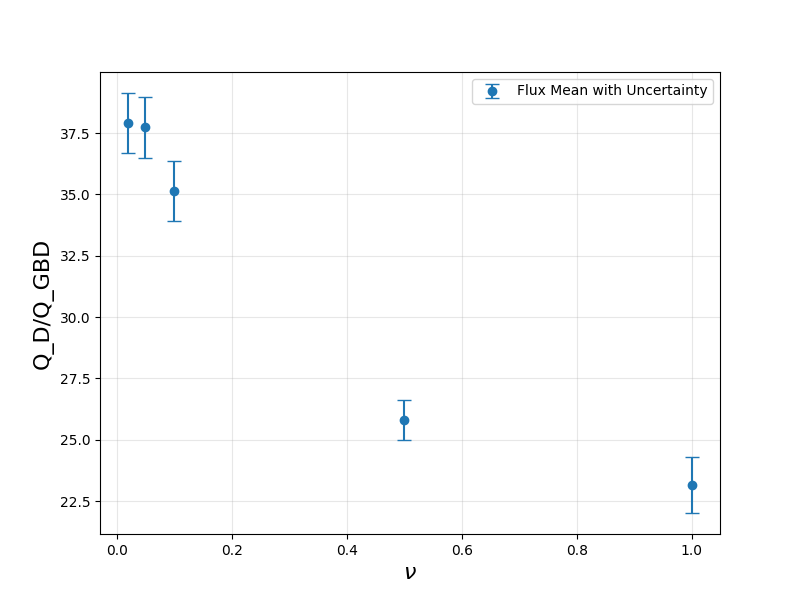
Process a set of CGYRO runs at different collisionalities, gather the mean and its uncertainty for each, and plot the flux versus collisionality.
data_paths = [
    DATA_DIR / "cgyro" / "output_nu0_02.csv",
    DATA_DIR / "cgyro" / "output_nu0_05.csv",
    DATA_DIR / "cgyro" / "output_nu0_10.csv",
    DATA_DIR / "cgyro" / "output_nu0_50.csv",
    DATA_DIR / "cgyro" / "output_nu1_0.csv",
]
col = pd.read_csv(data_paths[0]).columns[2]

my_wrkflw = qnds.RobustWorkflow(operate_safe=False, verbosity=0)
flux_means = np.empty((len(data_paths),), dtype=float)
flux_unc = np.empty((len(data_paths),), dtype=float)

with keep_figures():
    for i_data, data_path in enumerate(data_paths):
        print(f"\nProcessing {data_path}:")
        data_stream = qnds.from_csv(data_path, col)
        my_stats = my_wrkflw.process_data_stream(data_stream, col)
        if not my_stats[col]["metadata"]["mitigation"] == "Drop":
            plotter.plot_signal_basic_stats(
                data_stream, col, stats=my_stats, label=data_path
            )
        flux_means[i_data] = my_stats[col]["mean"]
        flux_unc[i_data] = my_stats[col]["mean_uncertainty"]
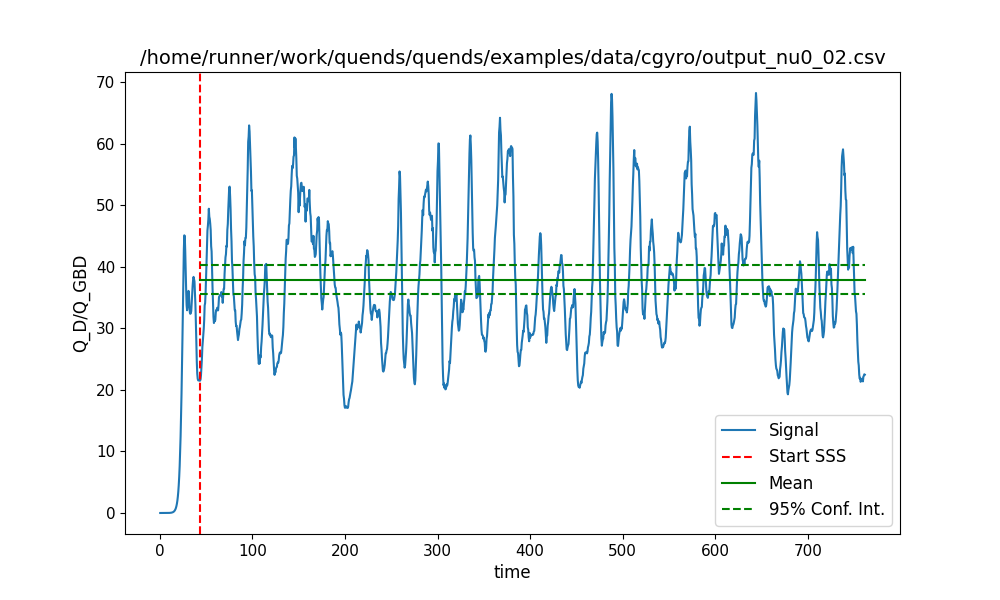
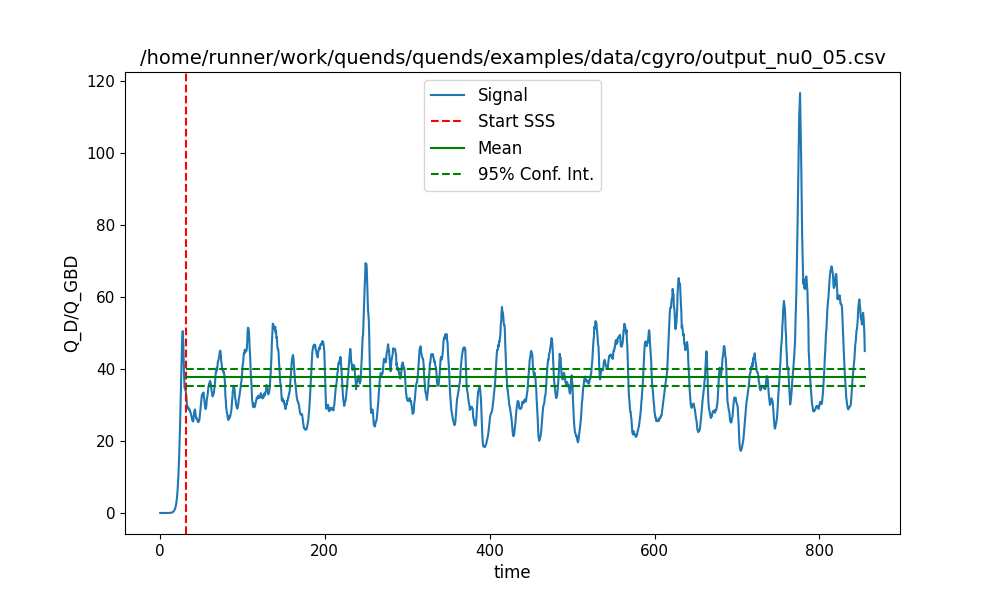
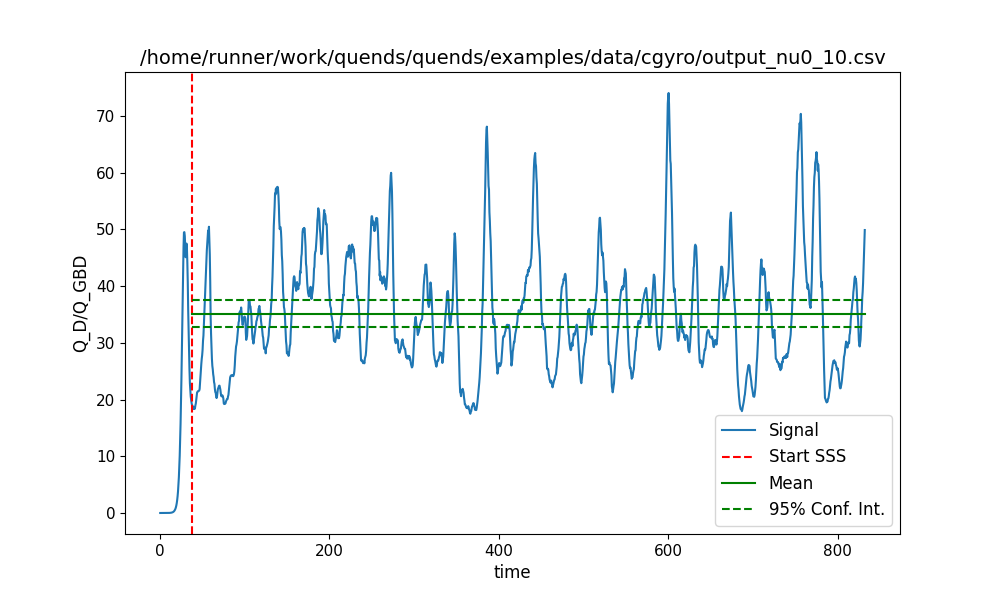
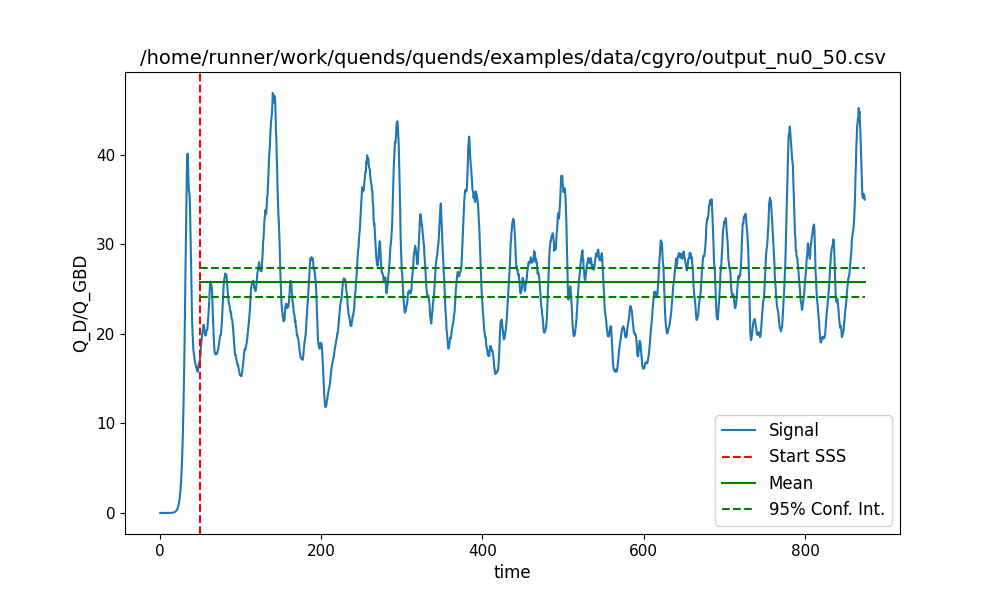
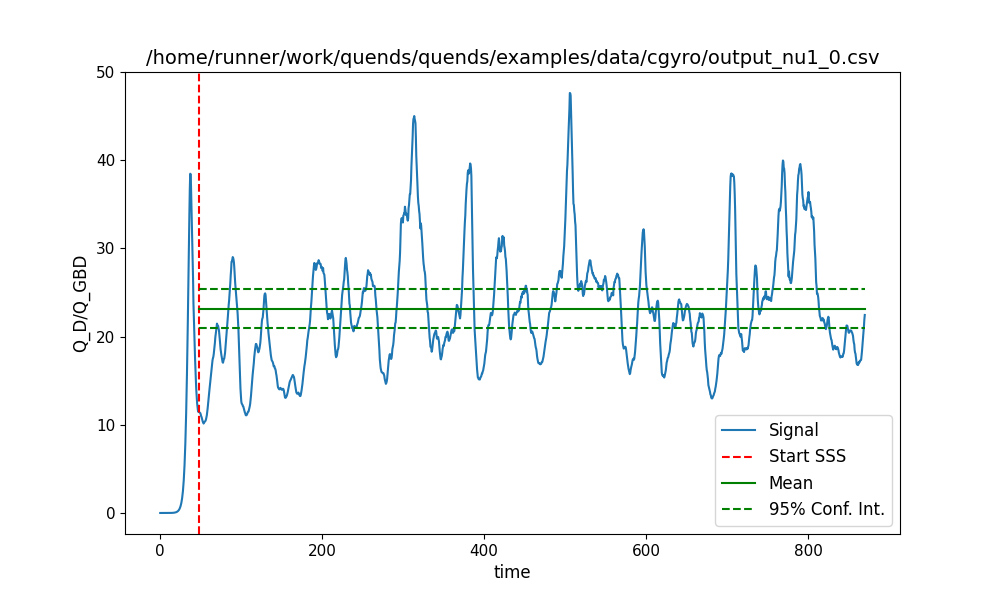
Processing /home/runner/work/quends/quends/examples/data/cgyro/output_nu0_02.csv:

Processing /home/runner/work/quends/quends/examples/data/cgyro/output_nu0_05.csv:

Processing /home/runner/work/quends/quends/examples/data/cgyro/output_nu0_10.csv:

Processing /home/runner/work/quends/quends/examples/data/cgyro/output_nu0_50.csv:

Processing /home/runner/work/quends/quends/examples/data/cgyro/output_nu1_0.csv:
Flux mean (with uncertainty) versus collisionality \(\nu\).
nu_values = []
for path in data_paths:
    match = re.search(r"nu([0-9_]+)\.csv", str(path))
    if match:
        nu_values.append(float(match.group(1).replace("_", ".")))

fig, ax = plt.subplots(figsize=(8, 6))
ax.errorbar(
    nu_values,
    flux_means,
    yerr=flux_unc,
    fmt="o",
    capsize=5,
    label="Flux Mean with Uncertainty",
)
ax.set_xlabel(r"$\nu$", size=16)
ax.set_ylabel(col, size=16)
ax.legend()
ax.grid(True, alpha=0.3)
Total running time of the script: (0 minutes 3.087 seconds)
Gallery generated by Sphinx-Gallery