Impact of cell-to-cell EQE variation on power output
Contents
Impact of cell-to-cell EQE variation on power output#
Content contributed by National Renewable Energy Laboratory under SETO award number 52776
Introduction#
Cells in a PV module are typically connected in series, hence module performance is limited by the cell generating the lowest current. Reduced cell performance can arise from manufacturing inconsistencies between cells, or in-operando events such as localised temperature hotspots and non-uniform module degradation.
Previous studies have investigated how external envrionmental factors such as non-uniform shading can lead to reduced individual cell or module performance, resulting in mismatch losses. While manufacturing inconsistencies between cells are often cited as a cause of intramodule mismatch losses, they are typically overlooked in the existing body of research.
One way to study the inherent differences between cells is through analyzing their external quantum efficiency (EQE). A cell’s EQE curve represents the efficiency with which incident photons of different wavelengths generate a photocurrent. Although this spectral effect on PV performance has been studied at the module level, no studies have analysed the spectral effect at the cell level and its potential role as a driver of mismatch losses at the module level.
To investigate the role of cell-to-cell variation on module performance, the following questions are posed:
How does the EQE vary between cells?
What is the impact on PV performance?
Does the performance impact vary seasonally or geographically?
Methodology#
EQE curves for each cell within each of 11 PV modules were measured by the Cell Measurement and Performance group at the National Renewable Energy Laboratory. These data are analysed in conjunction with one year of simulated 30-minute meteorological data, including spectral irradiance, spanning the contiguous United States at a resolution of around 0.2° longitude/latitude (around 20km). At this resolution, the dataset covers around 21,000 individual locations.
The PV devices studied cover a range of technologies, including monocrystalline silicon (monoSi) and polycrystalline silicon (polySi), and a range of cell architectures including Al-BSF (Aluminium Back Surface Field), IBC (Interdigitated Back Contact), PERC (Passivated Emitter and Rear Contact), PERT (Passivated Emitter Rear Totally Diffused), and SHJ (Silicon heterojunction).
To quantify the impact of intramodule EQE variation on PV device performance, the output from the worst cell (lowest performance) is compared with that of a hypothetical average cell, determined from the mean cell EQE.
The mean EQE curve is a useful approximation of the module EQE that a modeler may use to estimate module performance without the need to process multiple EQE curves and individual cell performances to determine which is driving the module performance under any given spectral irradiance condition. The power loss calculation thus provides an indication of the error incurred through this approximation.
Results#
How does the EQE vary between cells?#
There are four forms of EQE variation among the devices, classified by this study as follows:
Negligible
Amplitude
Wavelength
Mixed
The first type of variation is characterized by a tight distribution with a mean absolute deviation of between 1% and 3% that is largely independent of wavelength. Examples include the CSPoly270 and Itek360 modules. The EQE variation for the Panasonic325 module is also independent of wavelength, but a significantly greater amplitude-dominant variation is present with a relatively stable MAD of around 5%. This relatively uniform variation in EQE can be caused by a mixture of internal factors such as parasitic losses, and external factors such as reflection leading to variable illumination from cell to cell for each measurement. The third category is characterized predominantly by wavelength-dependent variation, such as in the case of the Qpoly280 device. Finally, devices such as the Mission300 module exhibit a mixture of wavelength-dependent and amplitude variation, thus falling into the fourth category. The cell-level EQE curves for all 11 modules are shown in Figure 1.
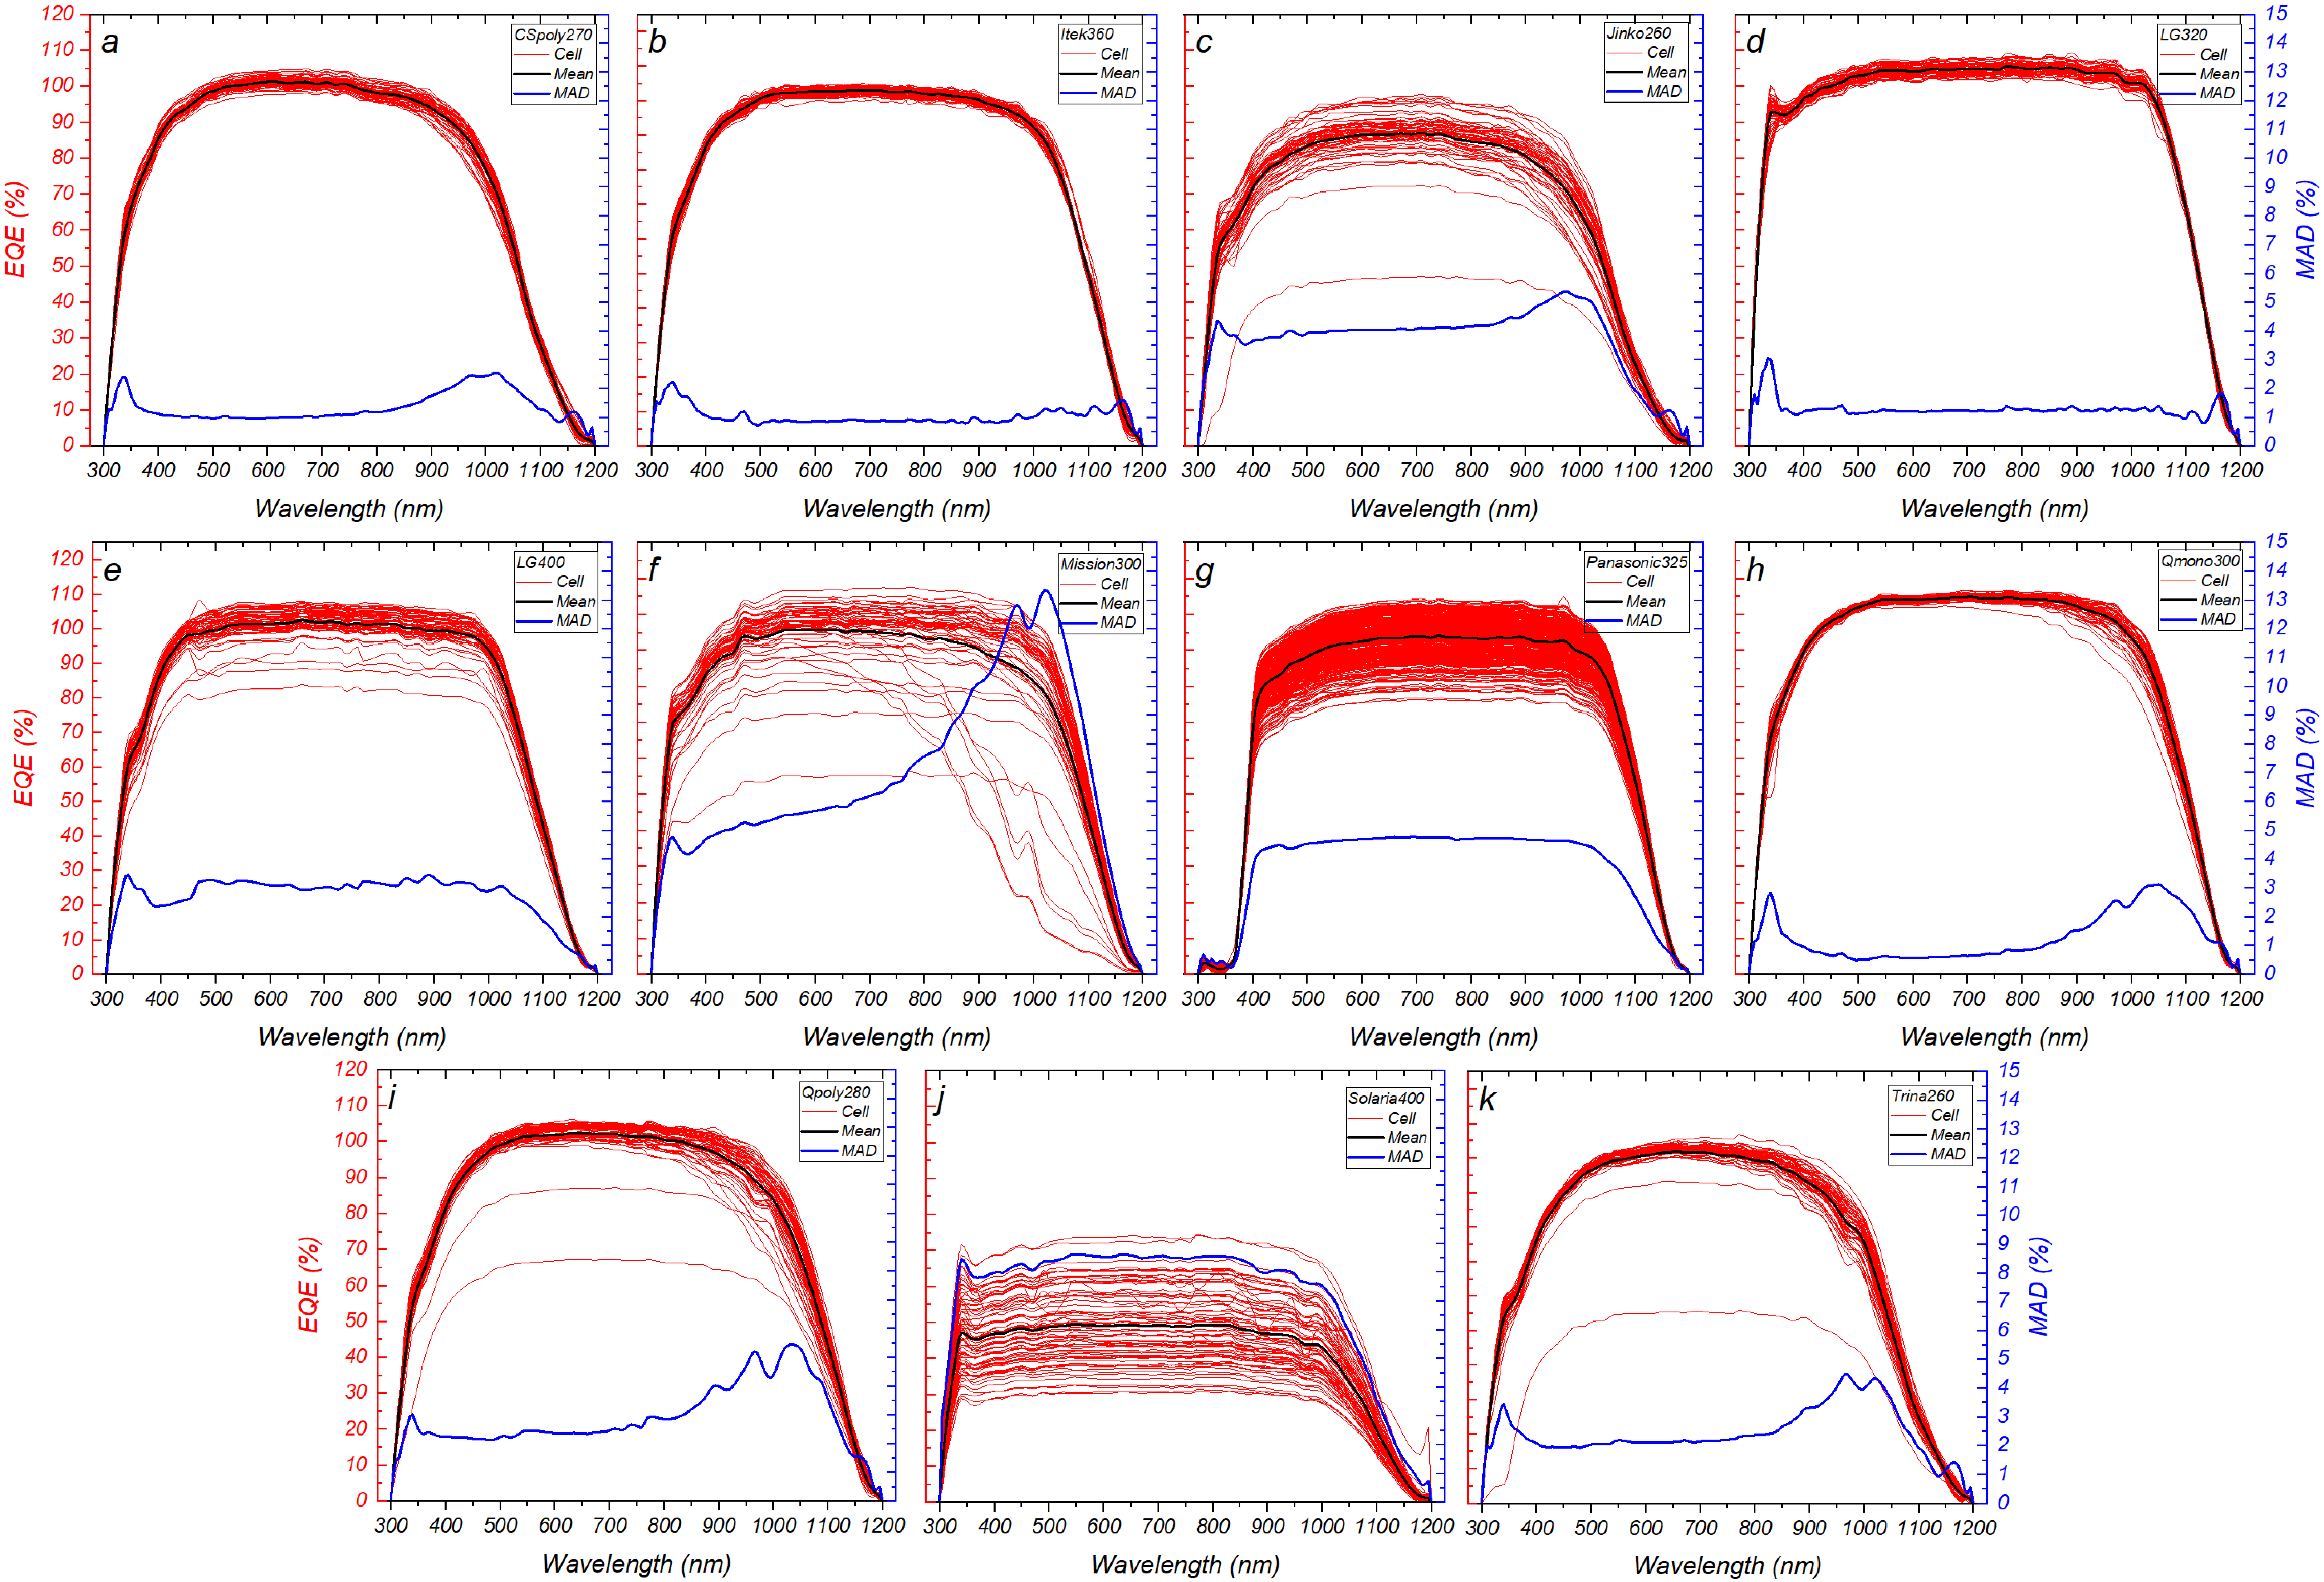
Figure 1. Cell EQE, median EQE, and MAD for the PV devices. (a) CSpoly270. (b) Itek360. (c) Jinko260. (d) LG320. (e) LG400. (f) Mission300. (g) Panasonic325. (h) Qmono300. (i) Qpoly280. (j) Solaria400. (k) Trina260.#
What is the impact on PV performance?#
Figure 2 shows the annual energy difference between the potential non-mismatched output, as determined by the mean EQE, and the realistic module output, as determined by the limiting cell. The data presented are for the Mission300 module, as an example. The overall energy difference, ΔE, is relatively low for all modules, rarely exceeding ±0.20%. Nonetheless, there is a link between the scale of loss and the type of EQE variation. Modules with greatest ΔE are also those whose intramodule EQE variation is characterized by a wavelength dependence (category 3) or mixed variation (category 4). Variation in amplitude is likely to result primarily from systematic measurement error, for example due to variable cell illumination, and its effect is removed through an inherent normalization in the calculation of M.
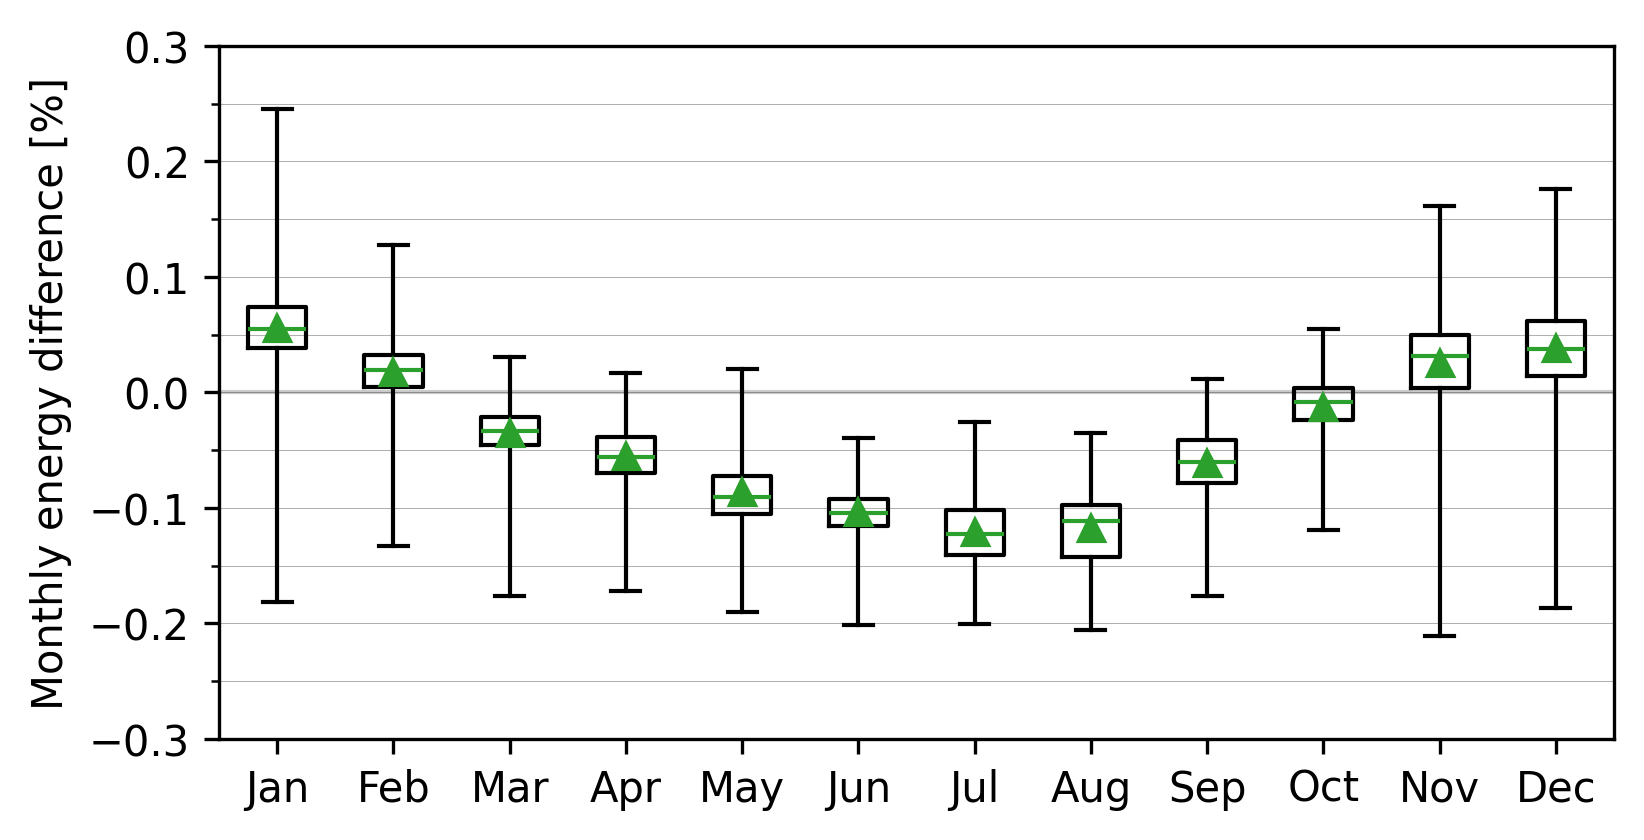
The monthly energy difference for the Mission300 module. The Mission300 exhibits category 4 (mixed) cell-to-cell EQE variation, resulting in one of the largest energy differences both on a monthly and annual scale. The triangle and horizontal bar represent the mean and median ΔE, respectively#
Does the performance impact vary seasonally or geographically?#
Could the low annual ΔE be a result of month-to-month variations cancelling each other out? The monthly breakdown of ΔE values shown in Figure 2 for the Mission300 module provide some insight into this. The range in each month represents the range of ΔE across the contiguous USA while the triangle and horizontal bar represent the mean and median ΔE, respectively. On a monthly scale, the energy difference is more significant than on an annual basis. The range from month to month is almost double the annual energy difference, with an approximately 50:50 split between positive and negative ΔE months.
Figure 3 presents the remaining results, complementary to Figure 2 but in a different form, for all modules. The boxplots in Figure 3 illustrate the seasonality in ΔE, calculated for the whole year as the difference between the maximum ΔE month and the minimum ΔE month.
Since ΔE can be positive or negative, besides reducing the annualized ΔE, this phenomenon also indicates that the driving cell under the prevailing spectrum can yield both an energy gain or loss with respect to performance driven by the mean EQE cell in the absence of intramodule EQE variation.
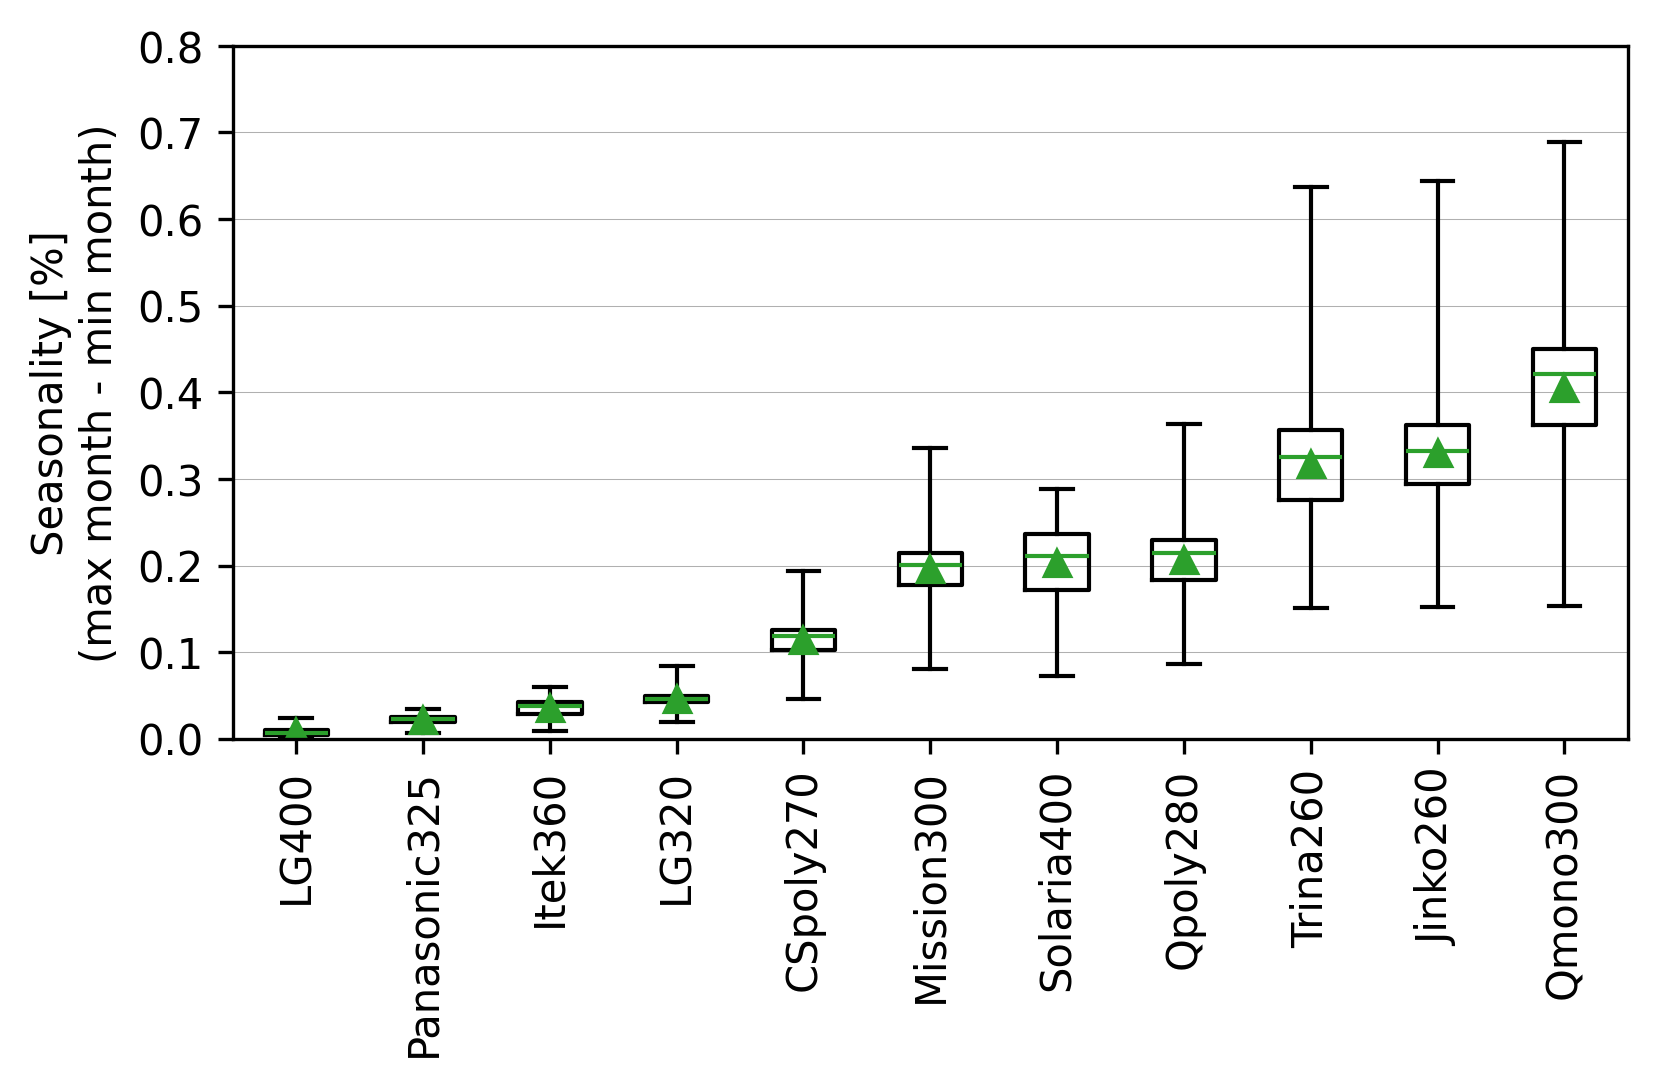
Figure 3. Seasonality breakdown for all 11 modules. The seasonality boxplots show the energy difference between the minimum and maximum ΔE months, for each location, for all 11 modules. In all plots, the horizontal bar represents the median, while the triangle represents the mean.#
In terms of geography, ΔE has a range of 0.46% across all locations, which is over four times the annualized ΔE. Another phenomenon related to location is the fact that the annual ΔE values are notably larger in the south/south east USA than in the western states. This effect is particularly significant in coastal states such as Florida, where the subtropical climate is driven by high levels of humidity that are known to increase the spectral influence on PV performance (Marion et al., 2014).
Figure 4 presents the energy difference data, across the contiguous US, for a sample of four of the 11 modules. Each one of the four modules represents one of the four identified categories of cell-level EQE variation. These modules are the Itek360 (negligible) module, Panasonic325 (amplitude) module, Qpoly280 (wavelength) module, and the Mission300 (mixed) module. Data for all 11 modules can be found at the end of this webpage.
Discussion#
While the absolute annual ΔE is restricted to only around 0.1%–0.2%, on a monthly basis the uncertainty due to cell-level EQE variation increases to almost 1%. This increase in error has implications for subannual PV performance assessment applications such as capacity testing, which can last only a few days/weeks at any given time over the course of the year.
Since the modules analyzed are new, one aspect to consider in future work is how these results may evolve over time. A direct correlation between wavelength-dependent cell-level EQE variation and increased energy losses is observed. PV module degradation is typically nonuniform across a module’s constituent cells, and different degradation modes can impact different wavelength regimes of the device EQE (Wang et al., 2020, Marion et al., 2014). Therefore, future studies should consider how nonuniform degradation and different degradation mechanisms may influence intramodule EQE variation and thus the energy losses reported in this work.
Conclusion#
Cell-level EQE data have been ananlysed to determine the scale and nature of intramodule EQE variation and the any associated mismatch power losses. Overall, four categories of EQE variation have been identified: negligible variation, amplitude variation, wavelength-dependent variation, and mixed variation. Amplitude variation is likely a result of systematic measurement error, but wavelength-dependent variation (shape fo the EQE curve) alters the spectral mismatch factor and, thus, determines the driving cell within the module. On an annual timescale, comparing each module to its respective hypothetical counterpart that does not exhibit cell-level EQE variation, the difference in energy output is below approximately ±0.2%. However, these energy losses suffered seasonal and geographical variation whereby on a month-to-month basis the energy difference can change by over four times the annualized difference, representing a range of almost 1%. The seasonality of these results has implications for subannual PV performance applications such as capacity testing. In future work, it will be important to consider how these results may evolve over time when the modules exposed outdoors. It is possible that nonuniform degradation over a module’s lifetime may exacerbate the energy losses reported in this work.
The full study may be found in Reference Daxini et al. (2025)
References#
Rajiv Daxini, Kevin S Anderson, Joshua S Stein, and Marios Theristis. Photovoltaic module spectral mismatch losses due to cell-level eqe variation. IEEE Journal of Photovoltaics, 2025. doi:10.1109/JPHOTOV.2025.3545820.
Bill Marion, Michael G Deceglie, and Timothy J Silverman. Analysis of measured photovoltaic module performance for florida, oregon, and colorado locations. Solar energy, 110:736–744, 2014.
Zehui Wang, Honglie Shen, Dongli Hu, Qingzhu Wei, Zhichun Ni, Yufang Li, Luanhong Sun, and Hongqiang Qian. Influence of double current injection annealing on anti-lid effect in mono-like cast silicon perc solar cells. Journal of Materials Science: Materials in Electronics, 31:3221–3227, 2020.
Data files#
The geographic datasets shown on this page are available in the GeoTIFF files listed below:
GeoTIFF file |
Description |
|---|---|
|
Effect of cell-level variation in spectral response on annual energy, for the CSmono275 module. |
|
Effect of cell-level variation in spectral response on annual energy, for the CSpoly270 module. |
|
Effect of cell-level variation in spectral response on annual energy, for the Itek360 module. |
|
Effect of cell-level variation in spectral response on annual energy, for the Jinko260 module. |
|
Effect of cell-level variation in spectral response on annual energy, for the LG320 module. |
|
Effect of cell-level variation in spectral response on annual energy, for the LG400 module. |
|
Effect of cell-level variation in spectral response on annual energy, for the Mission300 module. |
|
Effect of cell-level variation in spectral response on annual energy, for the Panasonic325 module. |
|
Effect of cell-level variation in spectral response on annual energy, for the Qmono300 module. |
|
Effect of cell-level variation in spectral response on annual energy, for the Qpoly280 module. |
|
Effect of cell-level variation in spectral response on annual energy, for the Solaria400 module. |
|
Effect of cell-level variation in spectral response on annual energy, for the Trina260 module. |


