sibl
Lesson 01: Plot a boundary interactively
The SIBL Mesh Engine can be used interactively through a Python terminal.
Goal
Use the siblenv environment to plot a discrete, 2D boundary.
Steps
From the command line, activate the siblenv environment, then start python.
> conda activate siblenv
> python
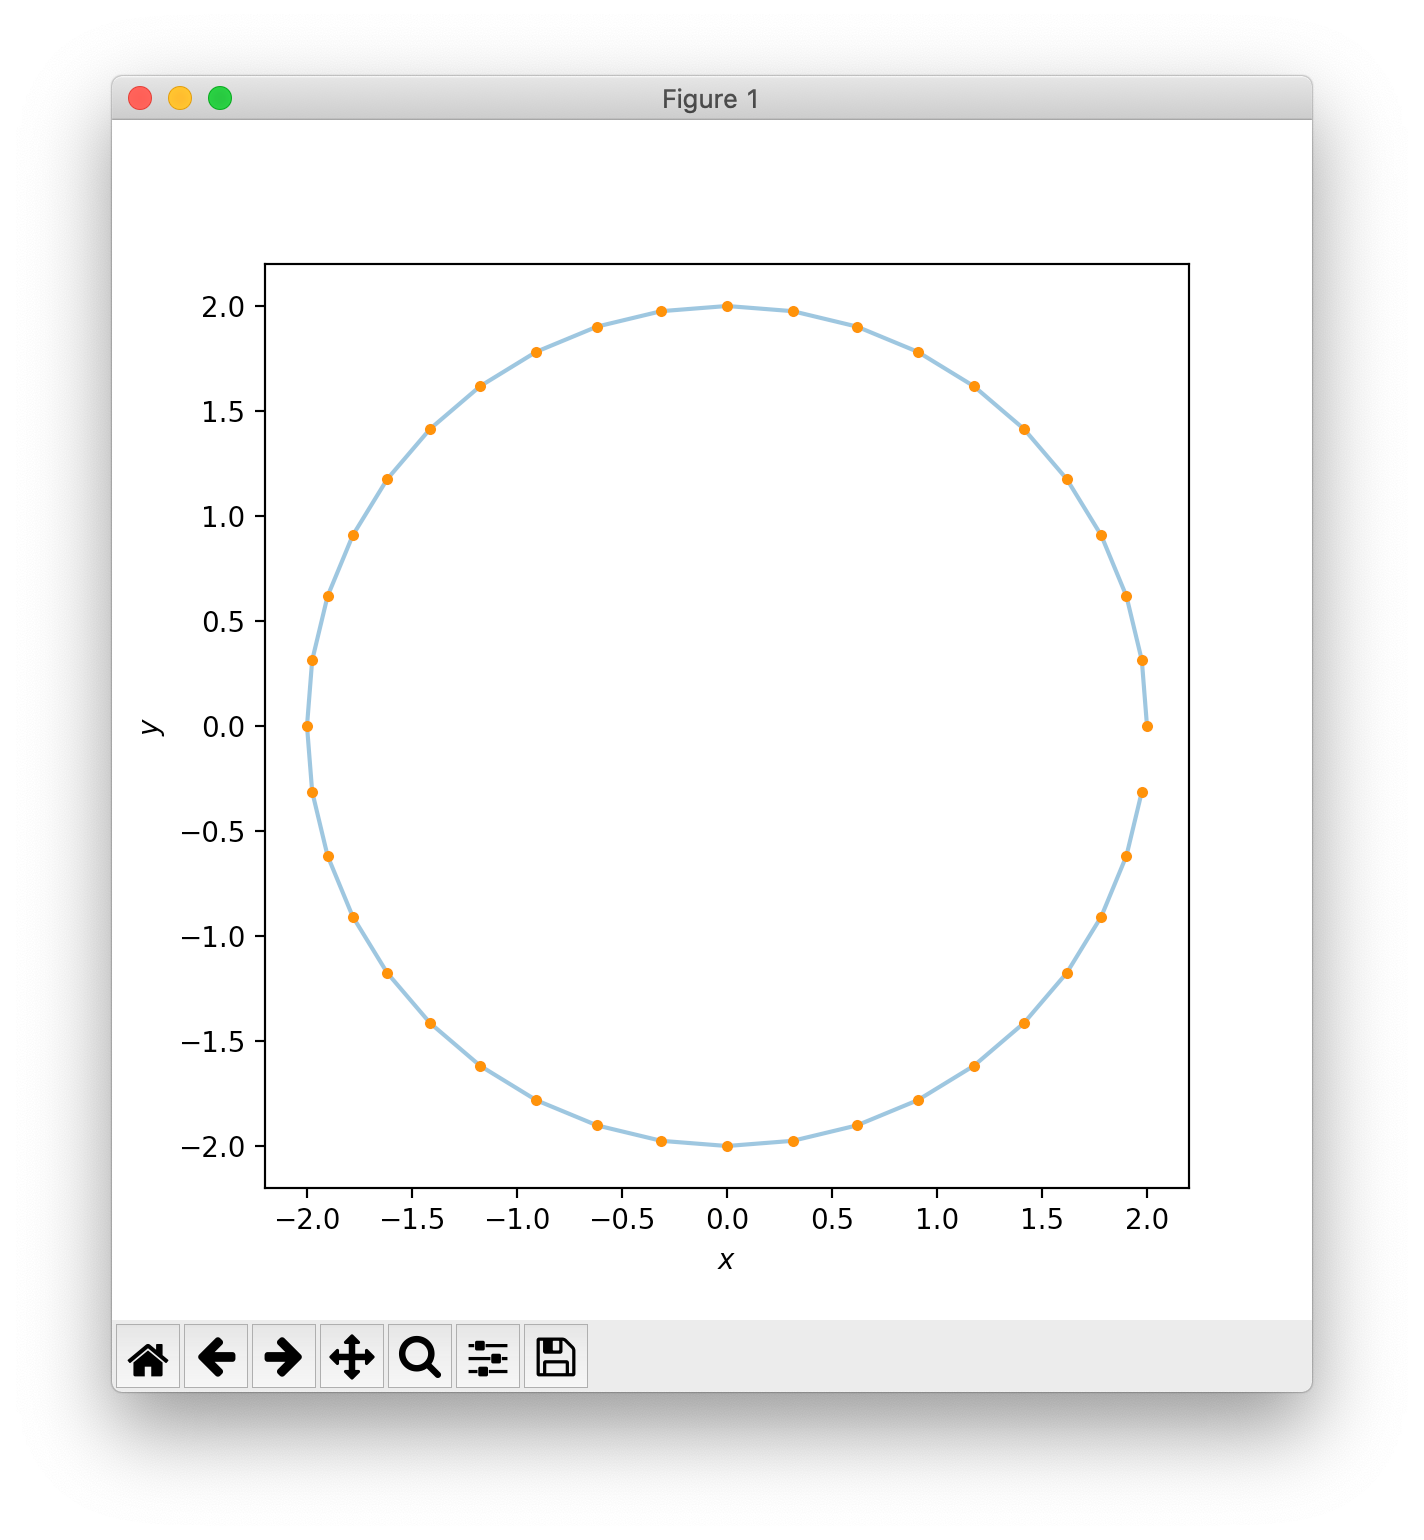
Using python interactively, create a boundary composed of (x, y) pairs and show the boundary and plot the result:
# type the following into the python terminal

import math
import matplotlib.pyplot as plt

n_samples = 40
radius = 2.0

# parameterize the curve
ts = tuple(range(n_samples))

# creates ts = (0, 1, 2, 3, 4, 5, 6, 7, 8, 9, 10, 11, 12, 13, 14, 15, 16, 17, 18, 19, 20, 21, 22, 23, 24, 25, 26, 27, 28, 29, 30, 31, 32, 33, 34, 35, 36, 37, 38, 39)

# create x and y points
xs = [radius * math.cos(2.0 * math.pi * t / n_samples) for t in ts]
ys = [radius * math.sin(2.0 * math.pi * t / n_samples) for t in ts]

s = 6.0  # 6.0 inches
fig = plt.figure(figsize=(s, s))

ax = fig.gca()

ax.plot(xs, ys, "-", alpha=0.5)  # show boundary as a continuous connected line
ax.plot(xs, ys, ".")  # show each discrete point that creates the boundary

ax.set_aspect("equal")
ax.set_xlabel(r"$x$")
ax.set_ylabel(r"$y$")

plt.axis("on")

plt.show()

Previous: Lesson 00
Next: Lesson 02